
Three Numbers Game
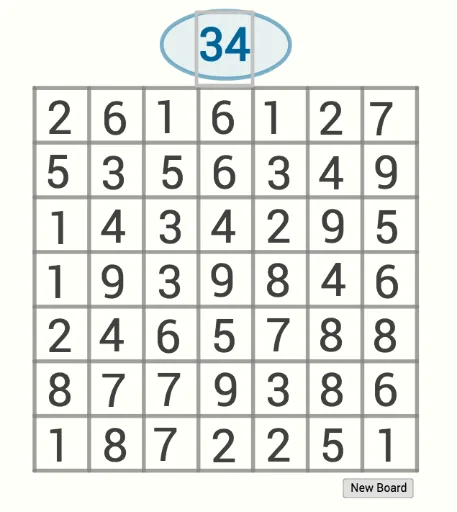
Loading the math board and drawing, please wait…
This example demonstrates an interactive graphical phenomenon based on three numbers, showcasing data distribution and function relationships through dynamic changes. Core math concepts include Probability & Statistics, Complex Numbers, Differential Calculus, and Function Graphing. Construction highlights the use of GeoGebra commands like Shuffle, Element, Sequence, and Ellipse with objects A1-A40. Suitable for high school and above learners to understand data visualization, function modeling, and complex number operations.
GeoGebra Commands & Parameters
Shuffle(L) → list2Element(list2, 1) → aElement(list2, 2) → bElement(list2, 3) → cElement(list2, 4) → dElement(list2, 5) → eElement(list2, 6) → fElement(list2, 7) → gElement(list2, 8) → hElement(list2, 9) → iElement(list2, 10) → jElement(list2, 11) → kElement(list2, 12) → lElement(list2, 13) → mElement(list2, 14) → nElement(list2, 15) → oElement(list2, 16) → pElement(list2, 17) → qElement(list2, 18) → rElement(list2, 19) → sElement(list2, 20) → tElement(list2, 21) → uElement(list2, 22) → vElement(list2, 23) → wElement(list2, 24) → a_1Element(list2, 25) → b_1Element(list2, 25) → c_1Element(list2, 26) → c_2Element(list2, 28) → d_1Element(list2, 29) → e_1Element(list2, 30) → f_1Element(list2, 31) → g_1Element(list2, 32) → h_1Element(list2, 33) → i_1Element(list2, 34) → j_1Element(list2, 35) → k_1Element(list2, 36) → l_1Element(list2, 37) → m_1Element(list2, 38) → n_1Element(list2, 39) → o_1Element(list2, 40) → p_1Element(list2, 41) → q_1Element(list2, 42) → r_1Element(list2, 43) → s_1Element(list2, 44) → t_1Element(list2, 45) → u_1Element(list2, 46) → v_1Element(list2, 47) → v_2Element(list2, 48) → v_3Element(list2, 49) → v_4Sequence(Segment[(n, 0), (n, 7)], n, 0, 7) → L1Sequence(Segment[(0, m), (7, m)], m, 0, 7) → L2Ellipse(A, B, C) → c_1Shuffle(L3) → list3Element(list3, target) → targ
AI Drawing Prompt Reference
Create an interactive graph based on three numbers, demonstrating data distribution and function relationships. First, randomly generate 30 numbers, then use these numbers to create a series of ellipses, with each ellipse's center determined by three numbers representing the ellipse's parameters. Finally, use these ellipses to illustrate complex numbers, probability and statistics, calculus, and function graphs.
The prompt above was compiled from the original drawing commands and is for reference only.