
Revisiting Correlation for Regression
Loading the math board and drawing, please wait…
In collections
Correlation and Regression
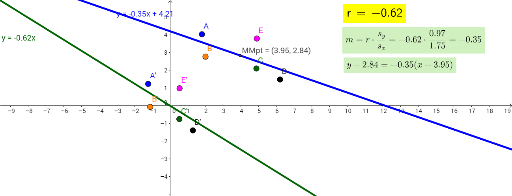
This example demonstrates the dynamic calculation of data points, regression lines, and correlation coefficients using GeoGebra. Key math concepts include PMCC, linear regression (FitLineY), slope, mean (MeanX, MeanY), and standard deviation (SDX, SDY). Construction highlights involve FitLineY for regression line fitting, PMCC for correlation calculation, LaTeX for formula display, Slope for slope computation, SDX, SDY for standard deviation, and MeanX, MeanY for mean calculation. Suitable for high school and above learners to understand data distribution, linear regression models, and statistical calculations.
GeoGebra Commands & Parameters
FitLineY({A, B, C, D, E}) → aPMCC({A, B, C, D, E}) → rLaTeX(r, true, true) → text1FitLineY({AA, BB, CC, DD, EE}) → bSlope(a) → mSDX({A, B, C, D, E}) → dSDY({A, B, C, D, E}) → eFitLineY({A_1, B_1, C_1, D_1, E_1}) → a_1PMCC({A_1, B_1, C_1, D_1, E_1}) → r_1Slope(a_1) → m_1SDX({A_1, B_1, C_1, D_1, E_1}) → d_1SDY({A_1, B_1, C_1, D_1, E_1}) → e_1MeanX({A, B, C, D, E}) → CxMeanX({A, B, C, D, E}) → C_xMeanX({A, B, C, D, E}) → XmnMeanY({A, B, C, D, E}) → Ymn