
Residuals to a Regression Line
Loading the math board and drawing, please wait…
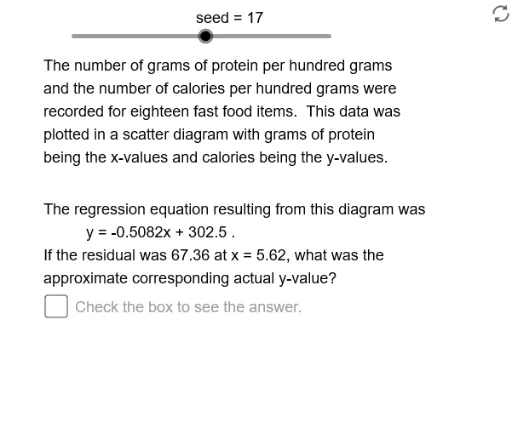
This example demonstrates residuals to a regression line. By analyzing the distance between data points and the regression line, it helps to better understand regression analysis concepts. Key mathematical concepts include regression analysis, residuals, and the Pearson's correlation coefficient. GeoGebra commands used include Element, Length, Sequence, Min, Max, If, PMCC, etc. Suitable for high school mathematics education and learning.
GeoGebra Commands & Parameters
Element(DtYSq, Op1) → DtY0Element(DtPlSq, Op1) → DtPlElement(DtXSq, Op1) → DtX0Length(DtX0) → SizeXSequence(Mod[3 + (17 * k), 37] + 30, k, 1, 32) → OpSqElement(OpSq, seed) → OpNm2Element(DtY0, Op2) → YValElement(DtX0, Op2) → XValMin(DtY0) → YMinMax(DtY0) → YMaxMin(DtX0) → XMnMax(DtX0) → XMxIf((5 * XScLB) ≤ XScUB, (5 * XScLB), If[(2 * XScLB) ≤ XScUB, (2 * XScLB), XScLB]) → XAxScIf((5 * YScLB) ≤ YScUB, (5 * YScLB), If[(2 * YScLB) ≤ YScUB, (2 * YScLB), YScLB]) → YAxScPMCC(DtX0, DtY0) → RIf(RgLnInt < 0, " - ", " + ") → Sgn1Element(CnfSq, Op3) → ConfIf(PVal < 0.0001, "< 0.0001", ("= " * PVal)) → PVlTxSequence(AdpX(Element[DtX0, k]), k, 1, SizeX) → PltXSequence(AdpY(Element[DtY0, k]), k, 1, SizeX) → PltYLength(DtY0) → SizeYIf(Resid < 0, " - ", " + ") → Sgn2