
Relative Frequencies and Categorical Bar Charts
Loading the math board and drawing, please wait…
In collections
Charts & Graphs
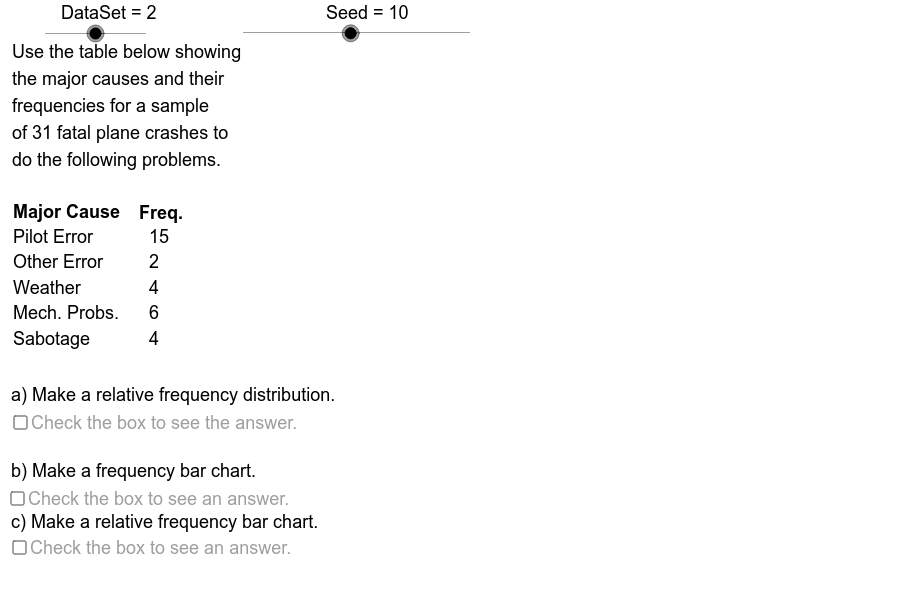
This example demonstrates constructing relative frequency distributions and categorical bar charts. Key math concepts include relative frequency, frequency distribution, and bar chart plotting. GeoGebra commands like Element, Sequence, RemoveUndefined, Sum, Max, Mod, CountIf, Segment are used along with objects such as CatNoSq, DataSet, CatNo1. Ideal for high school statistics and probability teaching and student practice.
GeoGebra Commands & Parameters
Element(CatNoSq, DataSet) → CatNo1Sequence(If[k > 96, 6, If[k > 91, 5, If[k > 85, 4, If[k > 79, 3, If[k > 66, 2, 1]]]]], k, 1, 100) → DtSq1Sequence(If[k > 91, 5, If[k > 69, 4, If[k > 57, 3, If[k > 51, 2, 1]]]], k, 1, 100) → DtSq2Sequence(If[k > 79, 4, If[k > 66, 3, If[k > 28, 2, 1]]], k, 1, 100) → DtSq3Element(DtSqSq, DataSet) → DtSqSequence(Element[DtSq, Mod[Seed + (47 * k), 100] + 1], k, 1, Sz1) → AcDtSequence(CountIf[x ≟ k, AcDt], k, 1, CatNo1) → FrqSq1Sequence(If[Element[FrqSq1, k] ≟ 0, NaN, Element[FrqSq1, k]], k, 1, CatNo1) → FrqSq2RemoveUndefined(FrqSq2) → FrqSq3Sum(FrqSq3) → Sz2Max(FrqSq3) → FrqMaxMax(1, floor(FrqMax / 3)) → FrqUntMod(Seed, 10) → StartElement(CatLabSq, DataSet) → CatLabElement(IndPrcSq, DataSet) → IndPrcElement(CatSq, DataSet) → Cat1Sequence(Sum[First[IndPrc1, k]], k, 1, 5) → CmlPrc1Sequence(Sum[First[IndPrc2, k]], k, 1, 4) → CmlPrc2Sequence(Sum[First[IndPrc3, k]], k, 1, 3) → CmlPrc3Sequence(If[Element[FrqSq2, k] ≠ 0, Element[Cat1, k]], k, 1, CatNo1) → Cat2RemoveUndefined(Cat2) → Cat3CountIf(x > 0, FrqSq1) → CatNo2Sequence(Element[FrqSq3, k] / Sz2, k, 1, CatNo2) → RFSqSequence(Text[Element[Cat3, k], ((-4), ClTp - (0.1 * k))], k, 1, CatNo2) → CatTxtSegment(UL, LL) → FrqAxSegment(LL, LR) → HrAxSegment(LR, UR) → RFAxSequence(Segment[(GL + ((k - 1) * CW), Adpt(Element[FrqSq3, k])), (GL + (k * CW), Adpt(Element[FrqSq3, k]))], k, 1, CatNo2) → BrTpSegment(LL, (GL, Adpt(Element[FrqSq3, 1]))) → LftSdSegment(LR, (GR, Adpt(Element[FrqSq3, CatNo2]))) → RgtSdSequence(Segment[(GL + (k * CW), GB), (GL + (k * CW), Adpt(Max[Element[FrqSq3, k], Element[FrqSq3, k + 1]]))], k, 1, CatNo2 - 1) → BrSdSequence((GL + ((k - 0.6) * CW) - 0.5, GB - 0.02), k, 1, CatNo2) → LblLcSqSequence(VerticalText[Element[Cat3, k], Element[LblLcSq, k]], k, 1, CatNo2) → BrLblSqElement(TtlSq, DataSet) → TitleSequence(Text[k, (GL - 3.5, GB + (k * FrqScl) - 0.02)], k, 0, AxMax, FrqUnt) → FrqLbSqSequence(Segment[(GL - 1, Adpt(k)), (GL, Adpt(k))], k, 0, AxMax, FrqUnt) → FrqAxTcSequence(Segment[(GR, Adpt(k)), (GR + 1, Adpt(k))], k, 0, AxMax, FrqUnt) → RFAxTcSequence(Text[k / Sz2, (GR + 1.1, GB + (k * FrqScl) - 0.02)], k, 0, AxMax, FrqUnt) → RFLblSqSequence(Text[Element[FrqSq3, k], (11, ClTp - (0.1 * k))], k, 1, CatNo2) → FrqTxt1Sequence(Text[(((Element[FrqSq3, k] * "/") * Sz2) * " ="), (15, ClTp - (0.1 * k))], k, 1, CatNo2) → RFC1TxSequence(Text[Element[RFSq, k], (22, ClTp - (0.1 * k))], k, 1, CatNo2) → RLFrTxSequence((k * FrqUnt / Sz2), k, 0, CatNo3) → GRFSqSequence((k * FrqUnt), k, 0, CatNo3) → GFSqSequence(Text[((((Element[GFSq, k + 1] * "/") * Sz2) * " = ") * Element[GRFSq, k + 1]), (75, (-1.53) + (0.1 * k))], k, 0, CatNo3) → RFC2Tx
AI Drawing Prompt Reference
Create a bar chart to show the relative frequencies of different score ranges. First, categorize the dataset into score ranges, calculate the frequency for each range, remove bars with zero frequency, determine the maximum frequency, and set the frequency axis scale interval. Finally, draw the bar chart, label each bar with its frequency and relative frequency.
The prompt above was compiled from the original drawing commands and is for reference only.