
Relationship between Velocity and Displacement in Uniform Rectilinear Motion
Loading the math board and drawing, please wait…
In collections
TFM: Introducción al Cálculo Infinitesimal (1º Bachillerato)
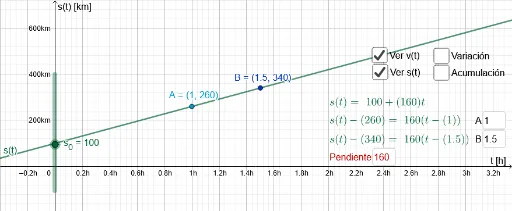
This example illustrates the relationship between velocity and displacement in uniform rectilinear motion. Key mathematical concepts include the variation of velocity and the accumulation of space. By controlling the space-time graph, changes in the velocity-time graph can be observed. GeoGebra commands used include Point, OrthogonalLine, Intersect, Polygon, Textfield, PointIn, etc. Suitable for high school physics and mathematics education.
GeoGebra Commands & Parameters
Point({A, s(A)}) → PAPoint({B, s(B)}) → PBOrthogonalLine(PB, xAxis) → fOrthogonalLine(PA, yAxis) → gIntersect(g, f) → CPolygon(PA, PB, C) → t1, c, a, bTextfield(A) → AInTextfield(B) → BInTextfield(v) → PendienteInOrthogonalLine(PA, xAxis) → hOrthogonalLine(PB, xAxis) → iIntersect(s', h) → DIntersect(s', i) → EIntersect(xAxis, i) → FIntersect(xAxis, h) → GPolygon(D, G, F, E) → c1, d, g_1, f_1, ePointIn(c1) → Puntoc1
AI Drawing Prompt Reference
Draw the relationship between velocity and displacement in uniform rectilinear motion. Start by taking points A and B on the x-axis to represent time and displacement, then draw a vertical line from A to the y-axis and a vertical line from B to the x-axis, with their intersection C representing velocity. Next, draw a triangle with points A, B, and C. Draw a vertical line from A to the x-axis and from B to the x-axis, with their intersections with the velocity line as points D and E, and with the x-axis as points F and G, forming another triangle.
The prompt above was compiled from the original drawing commands and is for reference only.