
Regions Bounded by Polar Curves
Loading the math board and drawing, please wait…
In collections
Multivariable Calculus
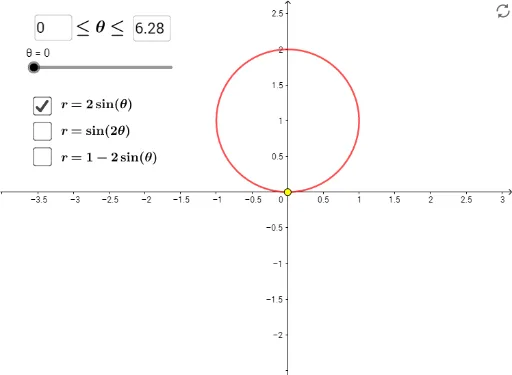
This example demonstrates how to use GeoGebra to draw polar curves and observe the regions bounded by these curves by adjusting parameters. Key mathematical concepts include polar coordinates, curve sketching, and area calculation. The construction uses commands like CurveCartesian, Textfield, and InputBox.
GeoGebra Commands & Parameters
CurveCartesian((f(t) * cos(t)), (f(t) * sin(t)), t, α, β) → CfTextfield(α) → InputBox1Textfield(β) → InputBox2CurveCartesian((g(t) * cos(t)), (g(t) * sin(t)), t, α, β) → CgCurveCartesian((h(t) * cos(t)), (h(t) * sin(t)), t, α, β) → ChCurveCartesian((g(t) * cos(t)), (g(t) * sin(t)), t, π, (3 * π / 2)) → dCurveCartesian((h(t) * cos(t)), (h(t) * sin(t)), t, π / 6, (5 * π / 6)) → e