
Rectangle Pouring: Dynamic Model of Linear Equations and Derivatives
Loading the math board and drawing, please wait…
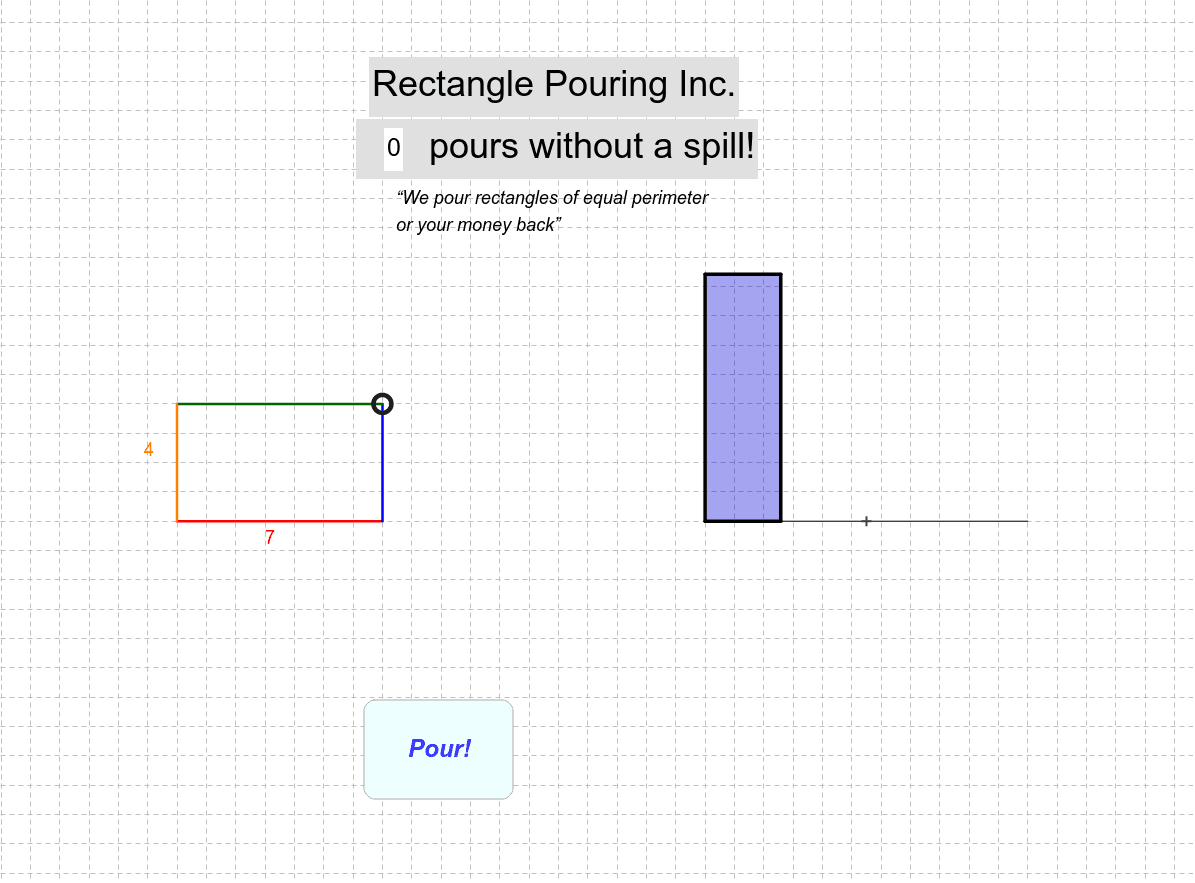
This GeoGebra example presents a dynamic 'rectangle pouring' scenario, illustrating how the water surface line, its intersection points with the container boundaries, and the water volume (area) change as the rectangular container is tilted or rotated. The core mathematical concepts involve linear equations (representing the water surface), derivatives (describing the rate of change of water height or area), rational numbers (for precise intersection coordinates), and step functions (possibly modeling piecewise behavior when the water touches different edges). The construction uses commands such as Line, OrthogonalLine, Intersect, Polygon, Circle, RandomUniform, Point, Segment, Vector, and Midpoint to build the rectangle and auxiliary elements. A random rectangle generator (RandRect) and dynamic sliders allow exploration of various tilt angles, updating objects like PouringRectangle in real time. This is suitable for high school or early college students, serving as an interactive tool for connecting geometry with algebra and for visualizing rates of change in introductory calculus.
GeoGebra Commands & Parameters
Line(J, xAxis) → jOrthogonalLine(C, yAxis) → bOrthogonalLine(C, xAxis) → aOrthogonalLine(A, yAxis) → dIntersect(a, d) → DOrthogonalLine(A, xAxis) → cIntersect(b, c) → BPolygon(A, D, C, B) → tgtRectangle, tgt_w, d_1, c_1, tgt_hCircle(J, tgtPerim / 2) → kIntersect(k, j, 2) → KRandomUniform(x(J) + 1, x(K) - 1) → RandRectIntersect(xAxis, yAxis) → EPoint(Circle[E, tgt_w]) → FSegment(E, F) → ePoint(Circle[F, tgt_h]) → GSegment(F, G) → fPoint(Circle[G, c_1]) → HSegment(G, H) → gPoint(Circle[H, d_1]) → ISegment(H, I) → hSegment(J, K) → lPoint(l) → LCircle(L, K) → pOrthogonalLine(L, l) → mIntersect(p, m, 2) → MOrthogonalLine(M, yAxis) → nOrthogonalLine(J, l) → qIntersect(n, q) → NPolygon(J, L, M, N) → PouringRectangle, j_1, l_1, m_1, n_1Circle(D, newAreaHeight) → rIntersect(r, a) → P, QOrthogonalLine(Q, a) → sIntersect(c, s) → RSegment(R, Q) → t_1Polygon(A, D, Q, R) → pouredAreaRectangle, a_2, d_2, q_1, r_1Vector(D, Q) → uVector(J, N) → vLine(waterS, m_1) → f_1Intersect(f_1, l_1) → TLine(waterT, tgt_w) → g_1Intersect(g_1, r_1) → OPolygon(A, D, waterT, O) → poly1, a_1, d_3, watert, oPolygon(J, L, T, waterS) → poly2, j_2, l_2, t_2, watersMidpoint(l) → S
AI Drawing Prompt Reference
Draw a rectangular container and show how the water level changes as the container is tilted. First, draw the four sides of the rectangle, then determine the water level line through intersection points, and finally form the water area by connecting these intersection points. Use a random number to generate a rectangle representing different angles of water level changes, and dynamically adjust to show the changes in the water level line and water area.
The prompt above was compiled from the original drawing commands and is for reference only.