
Rectangle Approximation Method
Loading the math board and drawing, please wait…
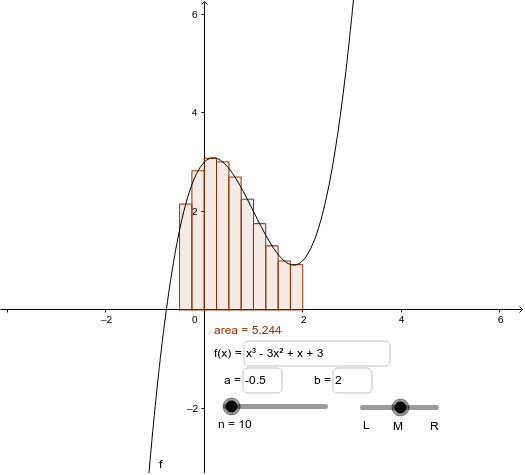
This example demonstrates the graphical phenomenon of approximating definite integrals using rectangles. It involves core mathematical concepts such as definite integrals, rectangle approximation, random variables, probability, arithmetic mean, and trigonometric functions. The construction uses GeoGebra commands like Textfield and RectangleSum, along with Function objects, variables a and b, parameters n and p, and multiple text objects (text1, text2, text3), highlighting the area calculation. It is suitable for high school and above students studying calculus and probability & statistics to understand the geometric meaning and approximation methods of integrals.
GeoGebra Commands & Parameters
Textfield(f) → FunctionTextfield(a) → a_{value}Textfield(b) → b_{value}RectangleSum(f, a, b, n, p) → area
AI Drawing Prompt Reference
Draw a coordinate plane with a smooth continuous curve. Below the curve, show a series of vertical rectangles approximating the area between the curve and the x-axis. The number and arrangement of rectangles should be adjustable, with each rectangle's height based on the function's value over the interval. Place two adjustable input boxes near the graph to set the start and end points of the interval, and display a numeric label showing the total approximated area. Emphasize the relationship between the curve, the rectangular approximation, and the input values.
The prompt above was compiled from the original drawing commands and is for reference only.