
Infinite Limits Example: Visualizing Asymptotic Behavior
Loading the math board and drawing, please wait…
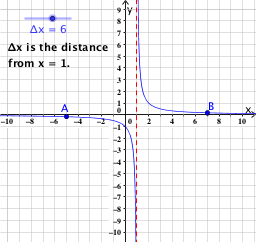
This GeoGebra example demonstrates the concept of infinite limits in calculus. It visualizes how a function approaches infinity near a vertical asymptote. Key construction elements include defining functions f and g, using delta x (Δx) for increments, and placing points A and B. Text1 provides dynamic labels. Ideal for high school or college students studying limits, asymptotes, and function behavior in pre-calculus or calculus courses.
GeoGebra Commands & Parameters
f(x) = 1 / (x - 1)Numeric Δx(6.0)(1 - Δx, f(1 - Δx))(1 + Δx, f(1 + Δx))x = 1
AI Drawing Prompt Reference
Draw the graph of the function f(x) = 1 / (x - 1) to show how the function approaches infinity as x approaches 1. Use a delta x of 6 to plot points on both sides of x=1 and observe the asymptotic behavior near x=1.
The prompt above was compiled from the original drawing commands and is for reference only.