
Polynomial Limits Visualization
Loading the math board and drawing, please wait…
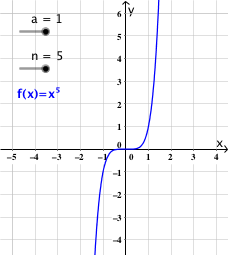
①This GeoGebra example dynamically demonstrates the limit behavior of polynomial functions as the variable approaches infinity or a specific point, showing how the graph changes with adjustable parameters. ②Core mathematical concepts include limits (Limit) and polynomial functions, touching on continuity, end behavior, and the visual interpretation of limit values. ③Construction summary lists objects a, n, f, and text1: a and n likely serve as sliders or parameters, f defines the polynomial function, and text1 displays dynamic limit results or annotations; users can adjust parameters to observe changes in the graph and limit. ④Suitable for high school to early college calculus courses, useful for classroom demonstrations or self-study to bridge graphical intuition and symbolic limit computation.
GeoGebra Commands & Parameters
Numeric a(1.0)Numeric n(5.0)f(x) = (a * x^(n))