
Reciprocal Function Parameter Variation
Loading the math board and drawing, please wait…
In collections
Graph Transformation
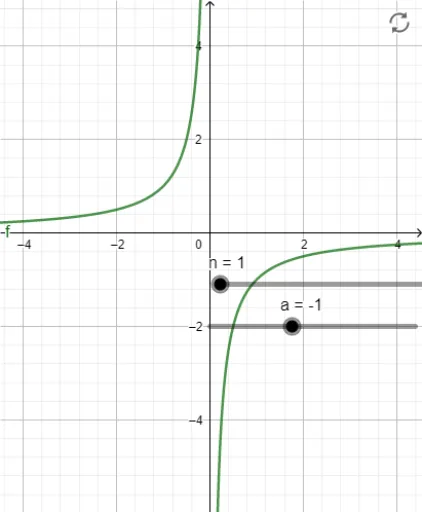
This GeoGebra example explores the reciprocal function f(x) = 1/x and demonstrates how parameter a affects the graph's scaling and translation. It visually illustrates function transformations, the relationship between independent and dependent variables, and asymptotic behavior. Construction uses the function object f, parameter a, and natural number n to enable interactive slider-based parameter adjustment, allowing real-time observation of graph changes. Suitable for high school function units, calculus introductions on limits and continuity, and inquiry-based learning activities.
GeoGebra Commands & Parameters
Numeric n(1)Numeric a(-1)f(x) = a / x^(n)
AI Drawing Prompt Reference
Draw a graph of a reciprocal function defined as a parameter divided by the variable raised to a positive integer power. The graph shows a smooth curve with hyperbolic shape, which scales vertically and shifts as the parameter changes. Include coordinate axes and dashed lines for horizontal and vertical asymptotes. Add a slider to adjust the parameter value, allowing real-time observation of how the curve transforms, including its approach to the axes. The visualization should clearly illustrate function transformations and asymptotic behavior for educational purposes.
The prompt above was compiled from the original drawing commands and is for reference only.