
Vertical Stretching
Loading the math board and drawing, please wait…
In collections
Graph Transformation
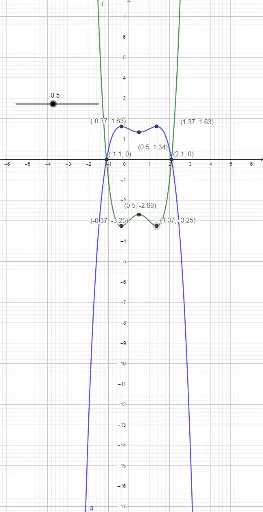
This example demonstrates the effect of vertical stretching on a function's graph, involving core concepts like function transformations, stretch factors, and graphical change patterns. It utilizes GeoGebra commands such as Extremum (to find extrema) and Intersect (to find intersections), along with objects like f (function), p (point), g (graph), and key points A, C, D, B, E, F, C_1, C_2. Suitable for high school mathematics teaching or student exploration of function graph properties.
GeoGebra Commands & Parameters
Extremum(f, -5, 5) → A, C, DExtremum(g, -5, 5) → B, E, FIntersect(f, y = 0, -5, 5) → C_1, C_2
AI Drawing Prompt Reference
Draw two function graphs to show the vertical stretching effect. Mark all extrema points for both functions within the range of -5 to 5, and find the intersection points of the original function with the x-axis. Use distinct colors or styles to highlight these key points for clear comparison of the transformation.
The prompt above was compiled from the original drawing commands and is for reference only.