
Rational Function Grapher
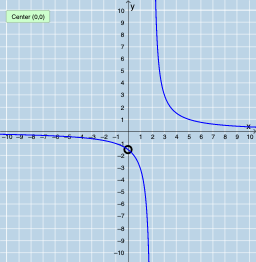
Loading the math board and drawing, please wait…
This example demonstrates the graphing of rational functions. Key mathematical concepts include functions, limits, and partial fractions. Using GeoGebra commands such as Root, Intersection, and Length, the graph of a rational function can be drawn and its roots and asymptotes observed. Suitable for high school mathematics education and learning.
GeoGebra Commands & Parameters
Root(Denominator[r]) → A, B, CIntersection(rootsd, rootsm) → commonrootsLength(commonroots) → numberofholesSequence(x = x(Element[commonroots, i]), i, 1, numberofholes, 1) → linesSequence(x(Element[commonroots, i]), i, 1, numberofholes, 1) → xvals, {0}Sequence((Element[xvals, i], r(Element[xvals, i])), i, 1, numberofholes, 1) → holesSequence(Limit[r, Element[xvals, i]], i, 1, numberofholes, 1) → list1Sequence((Element[xvals, i], Element[list1, i]), i, 1, numberofholes, 1) → list2Limit(r, Infinity) → aLimit(r, -Infinity) → bTextfield(f) → InputBox1Textfield(g) → InputBox2PartialFractions(r) → p
AI Drawing Prompt Reference
Graph a rational function, highlighting its roots and asymptotes, and marking all holes. First, find the roots of the denominator, then calculate the intersections of these roots with the numerator to locate the holes. Draw small circles at these hole positions, and compute the limits at infinity to determine the horizontal asymptotes. Finally, combine all parts to display the complete graph of the function.
The prompt above was compiled from the original drawing commands and is for reference only.