
Rate of Change of Volume in Melting Ice Cube
Loading the math board and drawing, please wait…
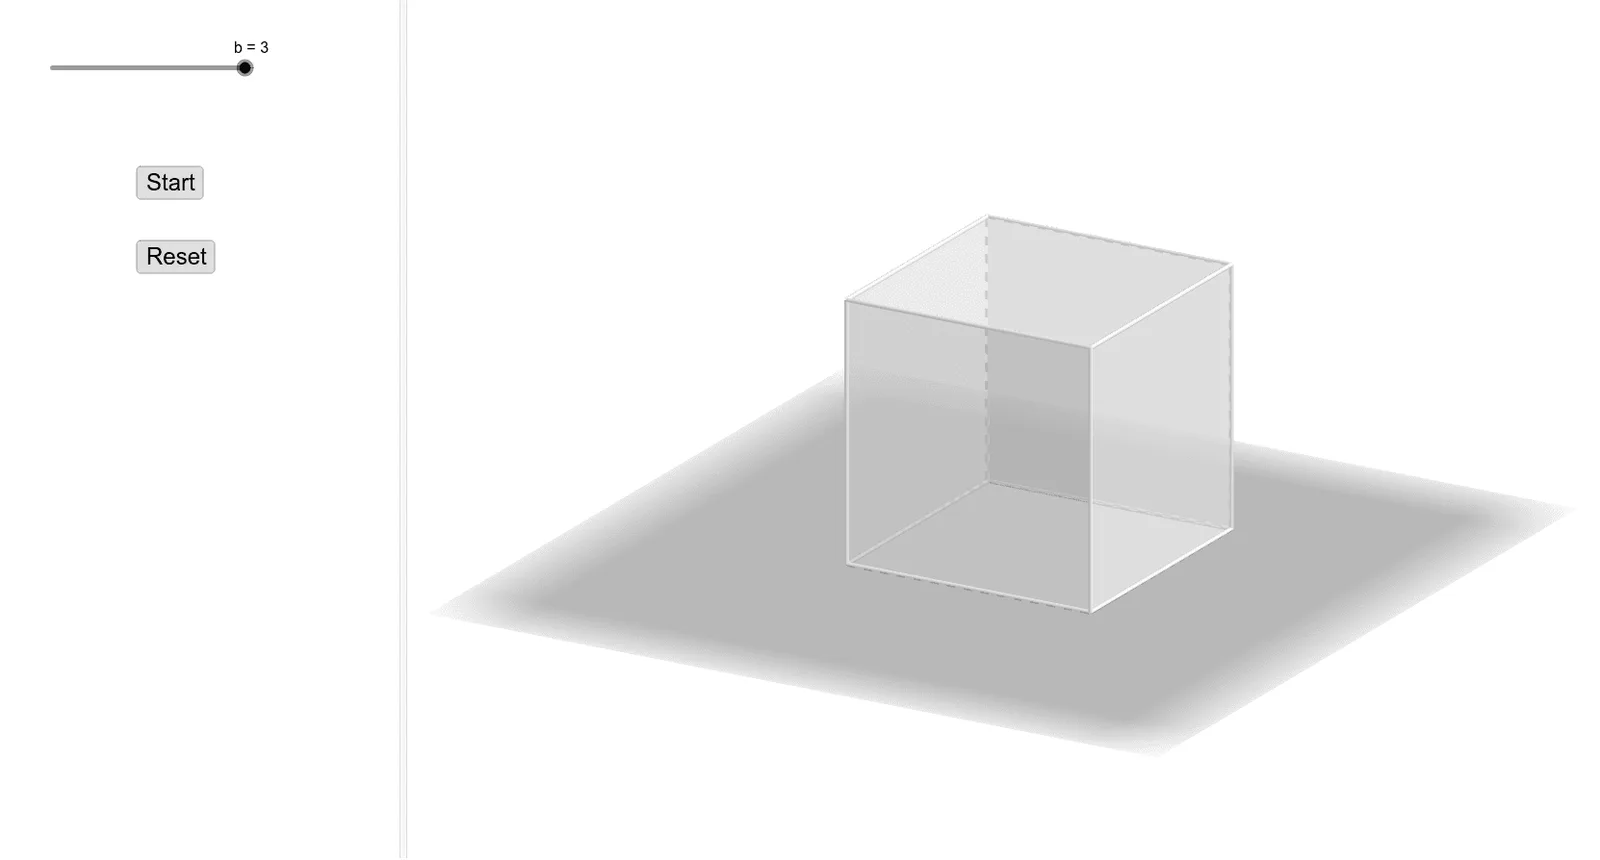
This example demonstrates the rate of change of volume in a melting ice cube. Key mathematical concepts include derivatives and calculus. By constructing a cube and observing its volume change over time, commands such as Intersect and Point are used. Suitable for high school and above students to learn about volume rate of change.
GeoGebra Commands & Parameters
Intersect(yAxis, zAxis) → APoint(Circle[B, Distance[A, B], Segment[A, B]]) → CCube(A, B, C) → a, D, faceCDHG, faceEFGH, edgeAD, edgeAB, edgeBC, edgeCD, edgeAE, edgeDH, edgeEH, edgeEF, E, edgeBF, edgeFG, edgeCG, edgeGH, F, G, H, faceABCD, faceADHE, faceABFE, faceBCGF
AI Drawing Prompt Reference
Draw a cube and show the change in its volume over time. First, identify the intersection point of the three axes in a coordinate system. Then, draw a circle with one axis point as the center and the distance to another axis point as the radius, marking the intersection points with the axes. Use these points to construct the vertices of the cube. Finally, draw the faces and edges of the cube, highlighting the volume change over time.
The prompt above was compiled from the original drawing commands and is for reference only.