
Dynamic Frenet–Serret Frame on a 3D Parametric Curve
Loading the math board and drawing, please wait…
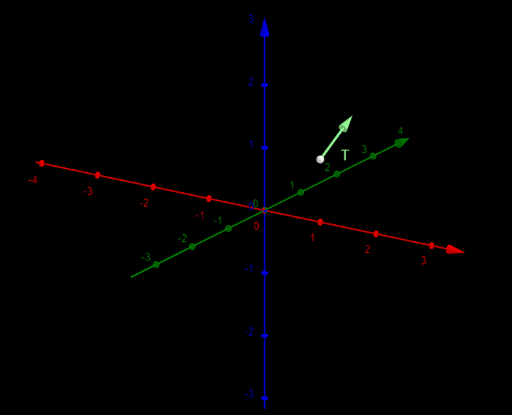
This example demonstrates how a moving particle’s local Frenet–Serret frame evolves in 3D as it travels along a continuous parametric curve. It visualizes the tangent vector T, the normal vector N, and the binormal vector B that change dynamically with the parameter t, exposing the curve’s local geometric behavior. Key concepts include parametric curves, differentiation (velocity and tangent direction from derivatives), unit vector normalization via norms, and constructing an orthonormal moving frame using derivative information that requires continuity/differentiability along the curve. Construction highlights: it uses Derivative to compute df, dg, dh from the coordinate functions and CurveCartesian to build the 3D curve; Translate and Textfield support positioning and labeling; norm and normdT are used to normalize vectors; components like Tx, Ty, Tz and dTx, dTy, dTz lead to computed directions Nx, Ny, Nz and Bx, By, Bz for the frame. Suitable for calculus and analytic geometry learners and for teaching/visualizing differential geometry of curves.
GeoGebra Commands & Parameters
Derivative(f) → dfDerivative(g) → dgDerivative(h) → dhDerivative(Tx) → dTxDerivative(Ty) → dTyDerivative(Tz) → dTzCurveCartesian(f(i), g(i), h(i), i, min, max) → cTranslate(Vector[(0, 0, 0), B], A) → uTranslate(Vector[(0, 0, 0), C], A) → vTranslate(Vector[(0, 0, 0), D], A) → wTextfield(f) → InputBox1Textfield(g) → InputBox2Textfield(h) → InputBox3Textfield(min) → InputBox4Textfield(max) → InputBox5
AI Drawing Prompt Reference
Draw a 3D parametric curve and visualize its dynamic tangent vector T, normal vector N, and binormal vector B as it changes with the parameter t. These vectors should be computed using derivatives of coordinate functions and normalized via norms to form an orthonormal moving frame. The drawing should include the curve, T, N, and B, with labels showing their evolution. The construction order is: define the curve, compute derivatives and norms, then draw and label the vectors.
The prompt above was compiled from the original drawing commands and is for reference only.