
Range of Sine Function
Loading the math board and drawing, please wait…
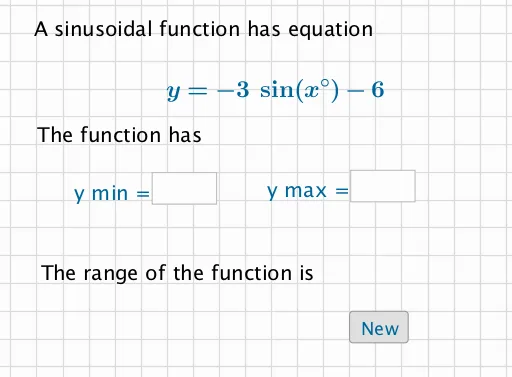
This example demonstrates the range of a sine function. The core mathematical concepts involved are trigonometric functions. By using GeoGebra commands such as RandomElement, Random, Textfield, Max, Min, etc., one can understand how to use these commands to draw and analyze the graph of a sine function. Suitable for high school mathematics education and learning.
GeoGebra Commands & Parameters
RandomElement(alist) → aRandom(-20, 50) → dTextfield(emptymin) → InputBox1Textfield(emptymax) → InputBox2Max({g(90), g(270)}) → ymaxMin({g(90), g(270)}) → ymin
AI Drawing Prompt Reference
Draw the graph of a sine function and indicate its range. First, plot the sine curve in the coordinate system. Then, draw two horizontal line segments on the y-axis to represent the maximum and minimum values of the sine function, calculated at 90 degrees and 270 degrees. Finally, add text boxes next to the graph to input custom minimum and maximum values for observing the sine function's behavior within different ranges.
The prompt above was compiled from the original drawing commands and is for reference only.