
Randomized Histograms (Unequal Class Widths)
Loading the math board and drawing, please wait…
In collections
Randomised Questions
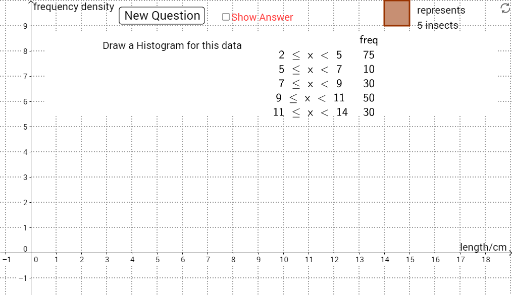
This example demonstrates how to generate random data and create histograms with unequal class widths. It involves core math concepts like histograms, exponential functions, normal distribution, and binomial distribution. GeoGebra commands and objects used include Random, Histogram, Polygon, Sum, TableText, Segment, and If. Suitable for high school and above in probability & statistics and data analysis education.
GeoGebra Commands & Parameters
Random(1, 3 + If[j, 0, 0]) → A1Random(1, 5 + If[j, 0, 0]) → B1Random(1, 5 + If[j, 0, 0]) → B2Random(1, 5 + If[j, 0, 0]) → B4Random(1, 5 + If[j, 0, 0]) → B5Random(1, 5 + If[j, 0, 0]) → B3Histogram(A1:A6, B1:B5) → a_1Random(2, 5) → b_1Polygon(A, B, C, D) → poly1, a, b, c, dPolygon(E, F, G, H) → poly2, e, f, g, hSum(B9:B13) → B15TableText(list1, "c") → text3Segment(C8, C9) → D8Segment(C9, C10) → D9Segment(C10, C11) → D10Segment(C11, C12) → D11Segment(C12, C13) → D12Segment(C13, (20, B9 + B10 + B11 + B12 + B13)) → D13Segment((-10, 0), C8) → D7Random(0, 1 + If[j, 0, 0]) → typeIf(($E8 ≤ $B$15 / 2) ∧ ($E9 > $B$15 / 2), 1, 0) → F9If((E9 ≤ $B$15 / 2) ∧ (E10 > $B$15 / 2), 1, 0) → F10If((E10 ≤ $B$15 / 2) ∧ (E11 > $B$15 / 2), 1, 0) → F11If((E11 ≤ $B$15 / 2) ∧ (E12 > $B$15 / 2), 1, 0) → F12If((E12 ≤ $B$15 / 2) ∧ (E13 > $B$15 / 2), 1, 0) → F13Sum(H9:H13) → H14If(($E8 ≤ $B$15 / 4) ∧ ($E9 > $B$15 / 4), 1, 0) → I9If(($E9 ≤ $B$15 / 4) ∧ ($E10 > $B$15 / 4), 1, 0) → I10If(($E10 ≤ $B$15 / 4) ∧ ($E11 > $B$15 / 4), 1, 0) → I11If(($E11 ≤ $B$15 / 4) ∧ ($E12 > $B$15 / 4), 1, 0) → I12If(($E12 ≤ $B$15 / 4) ∧ ($E13 > $B$15 / 4), 1, 0) → I13Sum(K9:K13) → K14If(($E8 ≤ (3 * $B$15 / 4)) ∧ ($E9 > (3 * $B$15 / 4)), 1, 0) → L9If(($E9 ≤ (3 * $B$15 / 4)) ∧ ($E10 > (3 * $B$15 / 4)), 1, 0) → L10If(($E10 ≤ (3 * $B$15 / 4)) ∧ ($E11 > (3 * $B$15 / 4)), 1, 0) → L11If(($E11 ≤ (3 * $B$15 / 4)) ∧ ($E12 > (3 * $B$15 / 4)), 1, 0) → L12If(($E12 ≤ (3 * $B$15 / 4)) ∧ ($E13 > (3 * $B$15 / 4)), 1, 0) → L13Sum(N9:N13) → N14
AI Drawing Prompt Reference
Generate a set of random data and draw a histogram with unequal class widths to demonstrate core probability and statistics concepts. Below the histogram, draw a polygon and plot multiple segments based on the data, connecting the polygon to the histogram. Use different colors to distinguish segments for different categories and label the data sum.
The prompt above was compiled from the original drawing commands and is for reference only.