
Random Hat Draw Probability Distribution Simulation
Loading the math board and drawing, please wait…
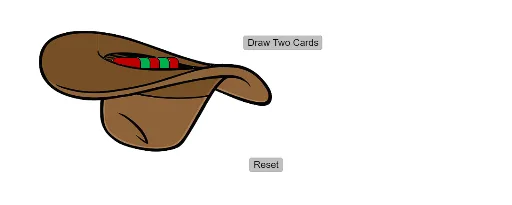
This example demonstrates the probability distribution of a random hat draw. It involves core math concepts like probability, random experiments, statistics, and confidence intervals. The construction uses GeoGebra commands such as RandomElement and objects like t_{1} to t_{7}, pic1 to pic7, E_1 to R, l1 to l2, button1, and button2. It is suitable for high school and above, ideal for teaching and visualizing probability & statistics.
GeoGebra Commands & Parameters
RandomElement(l1) → aRandomElement(l1) → b
AI Drawing Prompt Reference
Draw a simulation of random hat draw probability distribution, showing two randomly selected hat elements a and b, distinguished by different colors or shapes, to illustrate the characteristics of probability and statistics in random experiments.
The prompt above was compiled from the original drawing commands and is for reference only.