
Random Coin Flipping Simulation with Dot Plot
Loading the math board and drawing, please wait…
In collections
Statistics and Probability with Mr Downes
Permutation, Combination and Probability
GGBChat4: Statistics 1
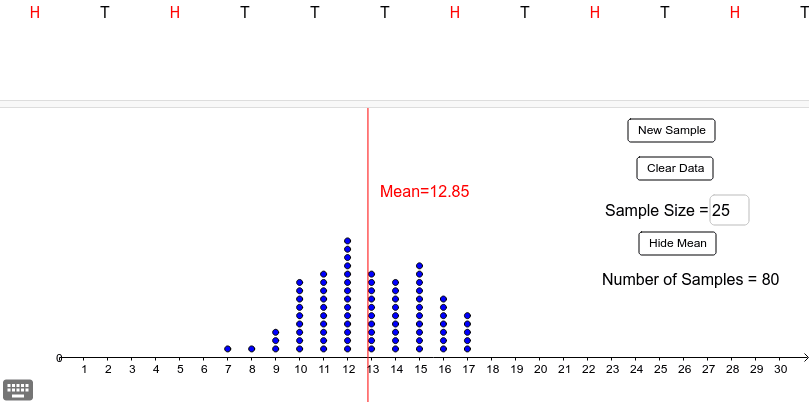
This example simulates flipping up to 25 coins and displays a dot plot of the number of heads per sample. It covers probability experiments, binomial distribution, sample mean, and statistical graphics. Construction uses GeoGebra commands If, DotPlot, Mean, Sum, Textfield, InputBox, and Button objects such as sampsize, samp, headlist, button1, button2, samples, meanhead, text1, inputBox1 to control repeated trials and visualize results. Suitable for middle‑school or high‑school probability and statistics lessons, classroom demos, or self‑study.
GeoGebra Commands & Parameters
If(sampsize ≤ 25, sampsize, 25) → sampDotPlot(headlist) → list1Mean(headlist) → meanheadTextfield(sampsize) → inputBox1If(A7 ≤ samp, Random[0, 1], 0) → A8If(B7 ≤ samp, Random[0, 1], 0) → B8If(C7 ≤ samp, Random[0, 1], 0) → C8If(D7 ≤ samp, Random[0, 1], 0) → D8If(E7 ≤ samp, Random[0, 1], 0) → E8If(F7 ≤ samp, Random[0, 1], 0) → F8If(G7 ≤ samp, Random[0, 1], 0) → G8If(H7 ≤ samp, Random[0, 1], 0) → H8If(I7 ≤ samp, Random[0, 1], 0) → I8If(J7 ≤ samp, Random[0, 1], 0) → J8If(K7 ≤ samp, Random[0, 1], 0) → K8If(L7 ≤ samp, Random[0, 1], 0) → L8If(M7 ≤ samp, Random[0, 1], 0) → M8If(N7 ≤ samp, Random[0, 1], 0) → N8If(O7 ≤ samp, Random[0, 1], 0) → O8If(P7 ≤ samp, Random[0, 1], 0) → P8If(Q7 ≤ samp, Random[0, 1], 0) → Q8If(R7 ≤ samp, Random[0, 1], 0) → R8If(S7 ≤ samp, Random[0, 1], 0) → S8If(T7 ≤ samp, Random[0, 1], 0) → T8If(U7 ≤ samp, Random[0, 1], 0) → U8If(V7 ≤ samp, Random[0, 1], 0) → V8If(W7 ≤ samp, Random[0, 1], 0) → W8If(X7 ≤ samp, Random[0, 1], 0) → X8If(Y7 ≤ samp, Random[0, 1], 0) → Y8If(A7 ≤ samp, If[A8 ≟ 1, "H", "T"]) → A1If(B7 ≤ samp, If[B8 ≟ 1, "H", "T"]) → B1If(C7 ≤ samp, If[C8 ≟ 1, "H", "T"]) → C1If(D7 ≤ samp, If[D8 ≟ 1, "H", "T"]) → D1If(E7 ≤ samp, If[E8 ≟ 1, "H", "T"]) → E1If(F7 ≤ samp, If[F8 ≟ 1, "H", "T"]) → F1If(G7 ≤ samp, If[G8 ≟ 1, "H", "T"]) → G1If(H7 ≤ samp, If[H8 ≟ 1, "H", "T"]) → H1If(I7 ≤ samp, If[I8 ≟ 1, "H", "T"]) → I1If(J7 ≤ samp, If[J8 ≟ 1, "H", "T"]) → J1If(K7 ≤ samp, If[K8 ≟ 1, "H", "T"]) → K1If(L7 ≤ samp, If[L8 ≟ 1, "H", "T"]) → L1If(M7 ≤ samp, If[M8 ≟ 1, "H", "T"]) → M1If(N7 ≤ samp, If[N8 ≟ 1, "H", "T"]) → N1If(O7 ≤ samp, If[O8 ≟ 1, "H", "T"]) → O1If(P7 ≤ samp, If[P8 ≟ 1, "H", "T"]) → P1If(Q7 ≤ samp, If[Q8 ≟ 1, "H", "T"]) → Q1If(R7 ≤ samp, If[R8 ≟ 1, "H", "T"]) → R1If(S7 ≤ samp, If[S8 ≟ 1, "H", "T"]) → S1If(T7 ≤ samp, If[T8 ≟ 1, "H", "T"]) → T1If(U7 ≤ samp, If[U8 ≟ 1, "H", "T"]) → U1If(V7 ≤ samp, If[V8 ≟ 1, "H", "T"]) → V1If(W7 ≤ samp, If[W8 ≟ 1, "H", "T"]) → W1If(X7 ≤ samp, If[X8 ≟ 1, "H", "T"]) → X1If(Y7 ≤ samp, If[Y8 ≟ 1, "H", "T"]) → Y1Sum(A8:Y8) → numheads
AI Drawing Prompt Reference
Create a statistical visualization for a coin-flipping simulation. Include an input box to set the number of coins per trial (up to 25). Below, display a row of coin outcomes labeled H for heads and T for tails. To the right, show a dot plot where the x-axis represents the number of heads in each trial and the y-axis shows the frequency of that count. Above the dot plot, display the mean number of heads across all trials. Add buttons to repeat trials, with each trial's result adding a dot to the plot, building a distribution. The layout should be clean and educational.
The prompt above was compiled from the original drawing commands and is for reference only.