
Radioactive Substance Decay
Loading the math board and drawing, please wait…
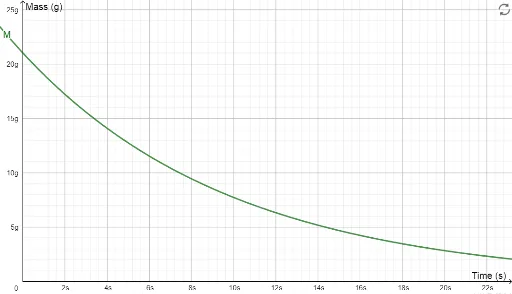
This example demonstrates the exponential decay of a radioactive substance over time, visualized as a curve. Key mathematical concepts include differential equations, exponential functions, polynomial functions, and decay constants. The construction involves objects M0 (initial amount), k (decay rate), and M (time). Suitable for high school and above students to learn about radioactive decay processes in physics and mathematics.
GeoGebra Commands & Parameters
Numeric M0(21)Numeric k(0.1)M(t) = (M0 * exp(((-k) * t)))
AI Drawing Prompt Reference
Draw a curve showing the exponential decay of a radioactive substance over time with an initial amount of 21 and a decay rate of 0.1, using time as the variable M, based on the function M0*exp(-k*t) to illustrate exponential functions and differential equations.
The prompt above was compiled from the original drawing commands and is for reference only.