
Malthusian Growth Model
Loading the math board and drawing, please wait…
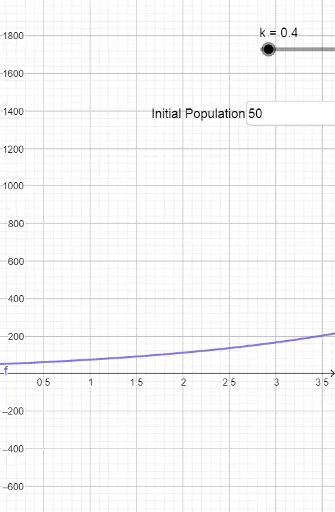
This example demonstrates the function graph and variation pattern of the Malthusian Growth Model. Key math concepts include exponential functions, differential equations, and the impact of parameter changes on function graphs. Construction highlights involve using the Textfield command to create text input fields, with objects including k (growth rate), P0 (initial population), f (function expression), and InputBox1 (input box). Suitable for high school and above students studying population growth models, function graph plotting, and parameter influence exploration.
GeoGebra Commands & Parameters
Textfield(P0) → InputBox1
AI Drawing Prompt Reference
Draw the graph of the Malthusian growth model, showing an exponential growth curve and its variation pattern. Include an interactive text input field for entering the initial population value, which dynamically updates the curve. The horizontal axis represents time, the vertical axis represents population size. The curve starts from the initial population and rises continuously at a fixed growth rate; changing the growth rate alters the steepness of the curve. The layout is simple, featuring one growth curve and an input box, emphasizing how parameters affect the function's shape.
The prompt above was compiled from the original drawing commands and is for reference only.