
Logistic Growth Model Interactive Demo
Loading the math board and drawing, please wait…
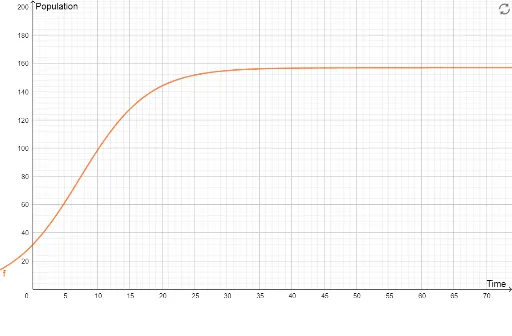
This GeoGebra example visually demonstrates the logistic growth model, illustrating how a population or quantity approaches a carrying capacity in an S-shaped curve over time. It focuses on the logistic differential equation dP/dt = rP(1-P/K), highlighting the roles of carrying capacity K, initial population P0, and growth rate r. The construction uses objects K, P0, r, and f, where K, P0, and r are likely adjustable sliders, and f represents the logistic function. Users can manipulate parameters to observe changes in the curve's steepness, inflection point, and asymptote. This is ideal for teaching differential equations, mathematical modeling, and population dynamics in high school or undergraduate courses, supporting interactive exploration of equilibrium solutions and parameter sensitivity.
GeoGebra Commands & Parameters
Numeric K(157)Numeric P0(31.5)Numeric r(0.19)f(x) = K / (1 + ((K / P0 - 1) * exp(((-r) * x))))
AI Drawing Prompt Reference
Draw a logistic growth model showing how a population or quantity approaches a carrying capacity in an S-shaped curve. Set the initial population P0 to 31.5, the carrying capacity K to 157, and the growth rate r to 0.19. First, create sliders for the carrying capacity K, initial population P0, and growth rate r, then plot the function f(x) = K / (1 + ((K / P0 - 1) * exp(((-r) * x)))).
The prompt above was compiled from the original drawing commands and is for reference only.