
SIR Epidemic Model Simulation with GeoGebra (Differential Equations)
Loading the math board and drawing, please wait…
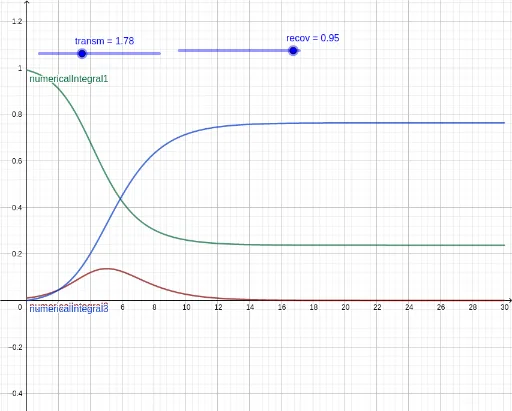
①This GeoGebra example demonstrates the classic SIR epidemic model, showing how the populations of Susceptible (S), Infected (I), and Recovered (R) individuals evolve over time using numerical solution of ordinary differential equations. ②Core mathematical concepts include a system of first-order ODEs (S', I', R'), parameters such as transmission rate (transm), recovery rate (recov), total population N, and initial conditions S0, I0, R0. ③Construction highlights: the NSolveODE command is used to numerically integrate the SIR system, with sliders (e.g., maxT) controlling the simulation duration, and three numerical integral objects (numericalIntegral1/2/3) generating the dynamic curves for S, I, and R. ④This is suitable for high school to university-level courses in mathematical modeling, differential equations, or biomathematics, and can also serve as an educational tool for understanding epidemic dynamics and intervention strategies.
GeoGebra Commands & Parameters
NSolveODE({S', I', R'}, 0, {S0, I0, R0}, maxT) → numericalIntegral1, numericalIntegral2, numericalIntegral3