
Exploring Polynomial Functions with Parameterized Graphs
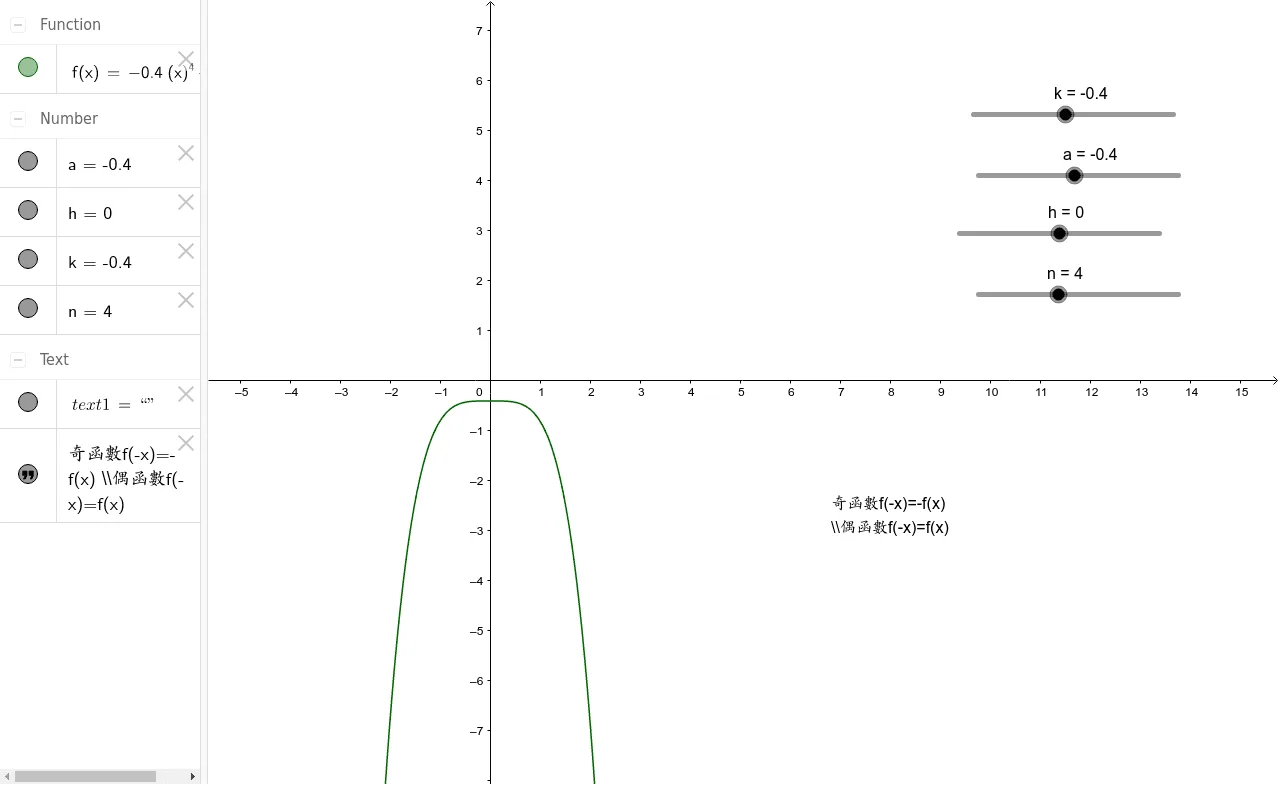
This interactive example demonstrates how the graph of a polynomial function changes as its parameters vary. It integrates core mathematical ideas such as polynomial structure, parameter influence on function behavior, and connections to trigonometric functions (e.g., cosine) and geometric shapes like equilateral triangles and parabolas. Constructed using GeoGebra objects a, h, n, and k as adjustable sliders to define the function f, along with text labels text1 and text2 for annotation. Ideal for high school or early university calculus courses to explore function modeling, parametric representation, and graphical transformations.
Loading the math board and drawing, please wait…