
Quadratic Vertex Form Investigation: Dynamic Parameter Exploration
Loading the math board and drawing, please wait…
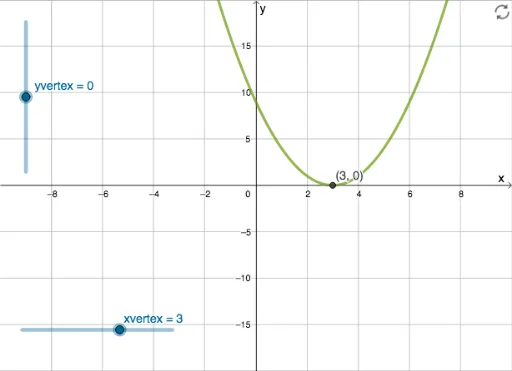
This GeoGebra example dynamically demonstrates the graph of a quadratic function in vertex form y=a(x-h)^2+k, allowing users to visually explore how parameters a, h, and k affect the parabola's opening direction, width, and vertex position. Core mathematical concepts include the vertex form of quadratic functions, axis of symmetry, vertex coordinates, and transformations such as vertical stretch/compression and horizontal/vertical translations. Construction highlights: sliders control parameters a, h, and k; functions f and g are defined; vertex coordinates (xvertex, yvertex) are computed; axis ranges (xmin, xmax, ymin, ymax) are adjustable; text objects (text1, text2) display current parameter values; and the vertex point V is plotted on the graph. Suitable for middle-to-high school students learning the geometric meaning of vertex form, and useful for teachers as an interactive demonstration or for student-led inquiry to connect algebraic expressions with graphical representations.
GeoGebra Commands & Parameters
Numeric xvertex(3)Numeric yvertex(0)-1010-2020f(x) = (x - xvertex)^(2) + yvertexg(x) = (-(x - xvertex)^(2)) + yvertexBoolean a(true)(xvertex, yvertex)
AI Drawing Prompt Reference
Create a dynamic graph exploring the vertex form of a quadratic function. Show an upward-opening parabola with its vertex controlled by adjustable parameters, initially near the origin. Also draw a downward-opening parabola sharing the same vertex. Use three sliders to adjust the leading coefficient, vertex x-coordinate, and vertex y-coordinate, changing the parabola's direction, width, and position. Mark the vertex with a distinct point and display text showing current parameter values and vertex coordinates. Allow adjustable axis ranges for zooming.
The prompt above was compiled from the original drawing commands and is for reference only.