
Quadratic Inequalities by GeoGebra Institute of MEI (3)
Loading the math board and drawing, please wait…
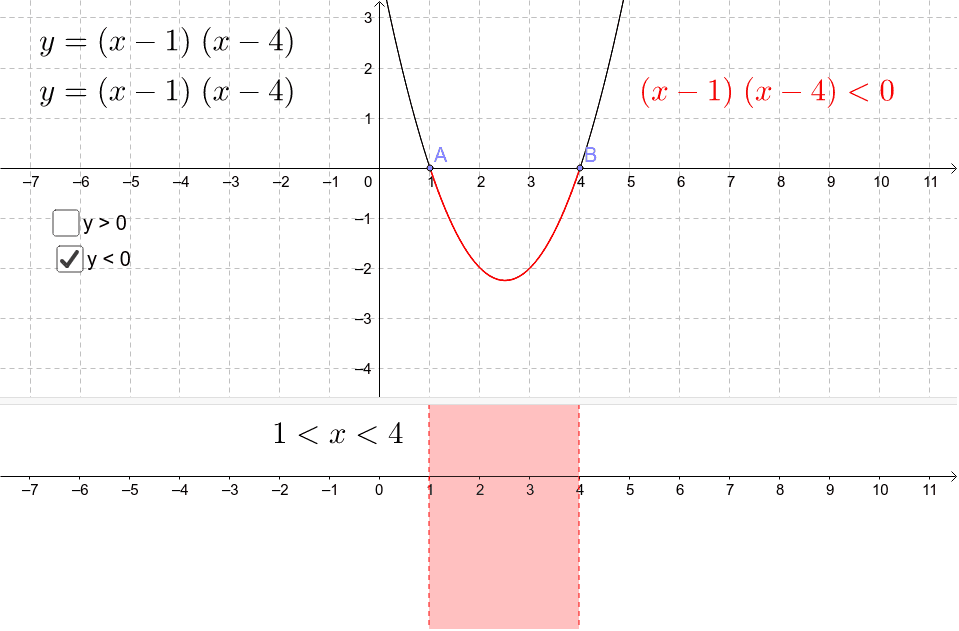
This example demonstrates the solution set of quadratic inequalities in the coordinate system. It involves core mathematical concepts such as quadratic functions, inequality solving, and root distribution. The construction uses GeoGebra commands/objects like Point, Ray, and Expand. Suitable for high school students learning about the graph and properties of quadratic inequalities.
GeoGebra Commands & Parameters
Point(xAxis) → ARay(A, C) → iPoint(i) → BExpand(f) → g
AI Drawing Prompt Reference
Draw the graph of a quadratic function in the coordinate system and show its inequality solution set. Start by plotting a point on the x-axis, then draw a ray from this point and determine another point on the ray. Next, expand the given quadratic function to obtain a new expression. Use these elements to plot the graph of the quadratic function and the shaded region representing its inequality solution set.
The prompt above was compiled from the original drawing commands and is for reference only.