
Quadratic Functions Transformations: Effects of a, h, k
Loading the math board and drawing, please wait…
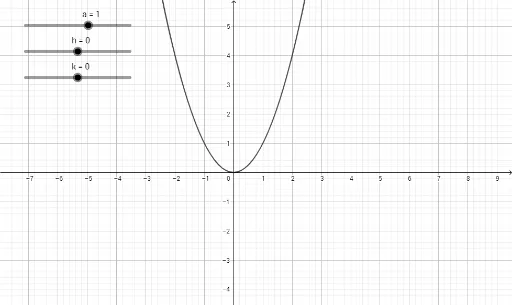
This GeoGebra example demonstrates how the parameters a, h, and k in the vertex form of a quadratic function y = a(x-h)² + k affect the graph of a parabola. It visually shows vertical stretching/compression and reflection (via a), horizontal translation (via h), and vertical translation (via k). The construction uses three slider objects (a, h, k) and a quadratic function expression, allowing users to drag sliders and observe real-time changes in the parabola's vertex, axis of symmetry, and opening direction. This interactive tool is ideal for middle school to high school students learning function transformations, and serves as a powerful classroom demonstration or self-study resource to build intuition about parameter-image relationships.
GeoGebra Commands & Parameters
Numeric a(1)Numeric h(0)Numeric k(0)y = (a * (x - h)^(2)) + k
AI Drawing Prompt Reference
Draw the graph of a quadratic function to show how parameters a, h, and k affect the parabola. Use three sliders to control the values of a, h, and k, and display the function y = a(x-h)^2 + k. Observe in real time how the vertex, axis of symmetry, and opening direction of the parabola change as the sliders are moved, visually demonstrating the impact of parameters on the graph.
The prompt above was compiled from the original drawing commands and is for reference only.