
Quadratic Function Transformations
Loading the math board and drawing, please wait…
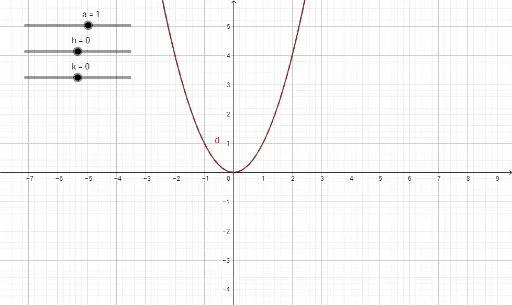
This example demonstrates the transformations of quadratic function graphs, including translations, scalings, and position changes. Key math concepts involve quadratic function properties, graph transformation rules, vertex coordinates, and axis of symmetry. It is constructed using GeoGebra commands/objects like a (coefficient), h (horizontal translation), k (vertical translation), c (vertical shift), and d (scaling). Suitable for high school mathematics education to understand the effects of function transformations on graphs.
GeoGebra Commands & Parameters
Numeric a(1)Numeric h(0)Numeric k(0)y = (a * (x - h)^(2)) + ky = x^(2)
AI Drawing Prompt Reference
Draw the graph of a quadratic function to demonstrate transformations such as translations, scalings, and position changes. Start by plotting the basic parabola, then adjust coefficients and parameters to show the effects of transformations on the function's graph, including horizontal and vertical translations, and vertical shifts, finally presenting the comparison between the transformed and original graphs.
The prompt above was compiled from the original drawing commands and is for reference only.