
Quadratic Functions: Slopes, Differences, and Differential Equations
Loading the math board and drawing, please wait…
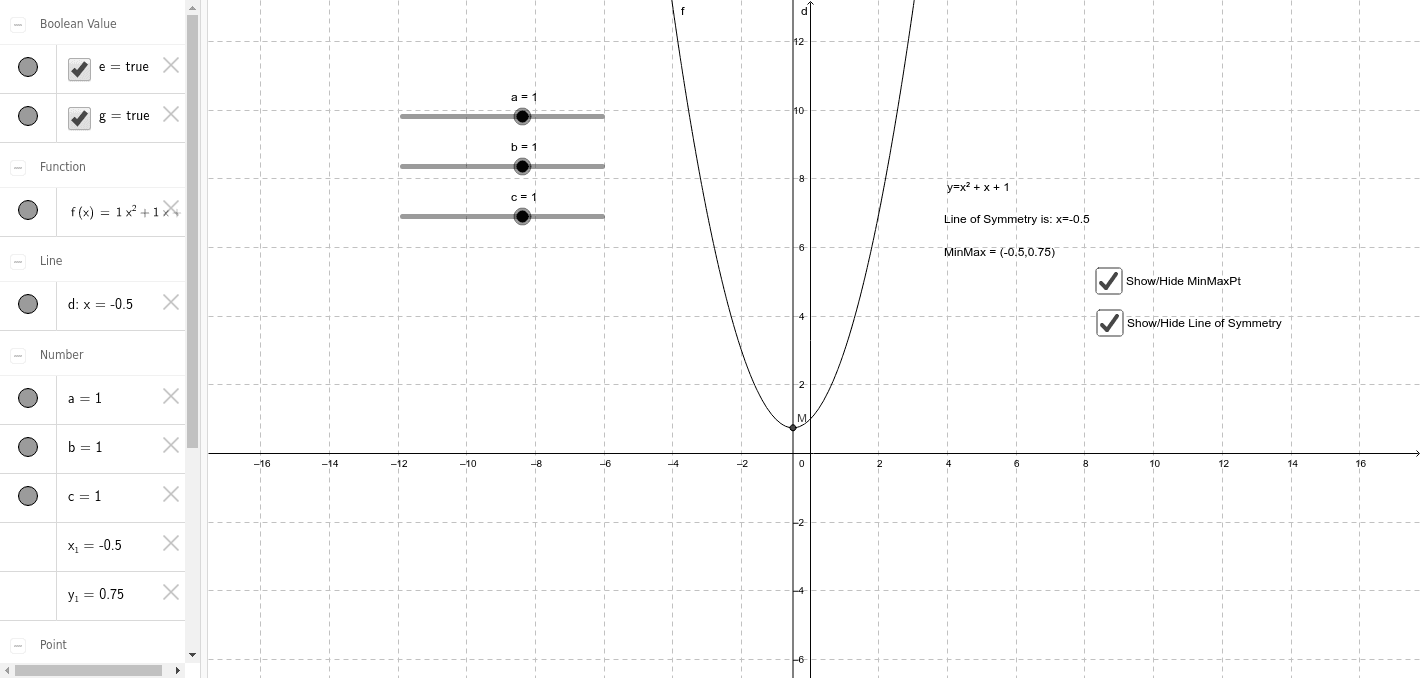
This GeoGebra example dynamically explores the graph of a quadratic function f(x)=ax²+bx+c, simultaneously displaying its slope, finite differences, percentage changes, and connections to differential equations. The core mathematical concepts include the vertex, axis of symmetry, discriminant of quadratics, as well as the tangent slope (derivative) at a point, finite difference approximations, and rates of change. Construction highlights: sliders control parameters a, b, c; the function f is defined; a point M with coordinates (x_1, y_1) is placed on the curve; a tangent line e and slope d are constructed; text objects text1, text2, text3 display numerical values; an object g may represent difference or slope comparisons. This resource is ideal for high school and introductory college students learning quadratic functions, basic derivatives, difference quotients, and the intuitive link between differential equations and function behavior, serving as an excellent visual teaching tool for calculus readiness.
GeoGebra Commands & Parameters
Numeric a(1.0)Numeric b(1.0)Numeric c(1.0)f(x) = (a * x^(2)) + (b * x) + c((-b)) / ((2 * a))f(x_1)(x_1, y_1)x = x_1Boolean e(true)Boolean g(true)