
Quadratic Functions and Discriminant
Loading the math board and drawing, please wait…
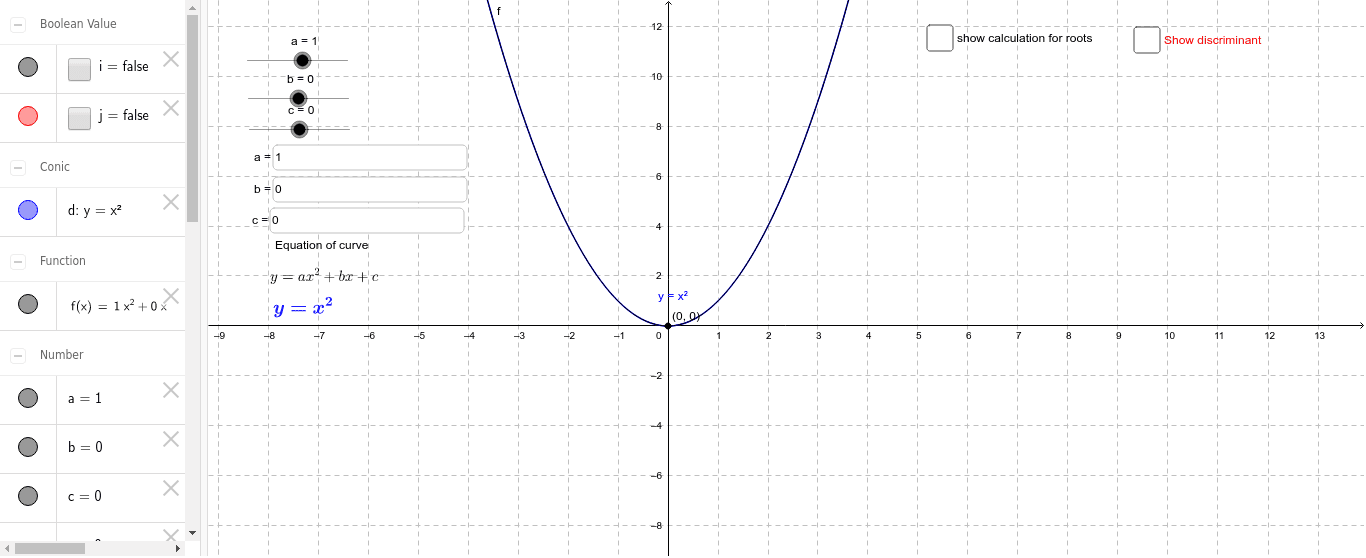
This example demonstrates the graph of a quadratic function and the application of the discriminant. Key mathematical concepts include quadratic functions, discriminant, and the nature of roots. Using GeoGebra commands such as Intersect and Textfield, the example dynamically shows the intersection points of the quadratic function with the x-axis. Suitable for high school mathematics education, helping students understand the properties of quadratic functions and the practical significance of the discriminant.
GeoGebra Commands & Parameters
Intersect(d, xAxis, 2) → AIntersect(d, xAxis, 1) → BTextfield(a) → inputBox1Textfield(b) → inputBox2Textfield(c) → inputBox3
AI Drawing Prompt Reference
Draw the graph of a quadratic function and show its intersection points with the x-axis. Change the coefficients a, b, and c by inputting values in the text fields to observe the changes in the intersection points. The quadratic function is in the form y=ax^2+bx+c, and the intersection points A and B will be dynamically displayed.
The prompt above was compiled from the original drawing commands and is for reference only.