
Graphs of y^2 = kx
Loading the math board and drawing, please wait…
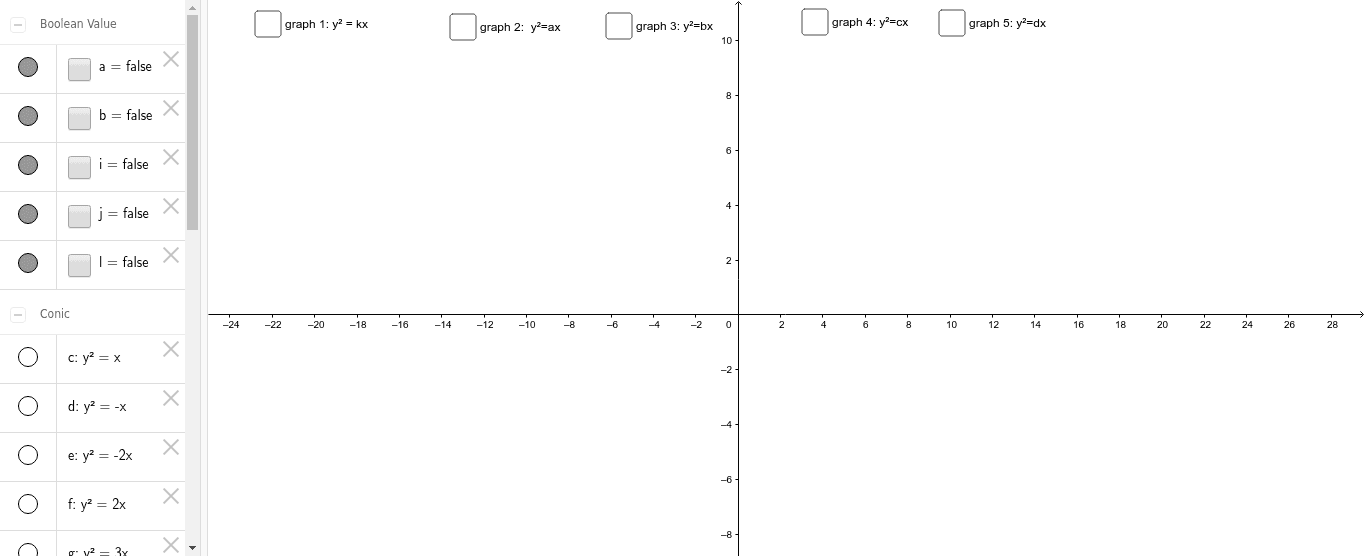
This example demonstrates the graphs of the parabola y^2 = kx as the parameter k varies, covering core concepts in coordinate geometry and parametric equations. It utilizes GeoGebra commands like K_1, c, k_2, d, a, a_1, etc., to construct and animate the parabola, making it suitable for high school and advanced learners studying parabolic properties and parameter effects.
GeoGebra Commands & Parameters
Numeric K_1(1.0)y^(2) = (K_1 * x)Numeric k_2(-1.0)y^(2) = (k_2 * x)Boolean a(false)Numeric a_1(2.0)Numeric a_2(-2.0)Numeric b_1(3.0)Numeric b_2(-3.0)Numeric c_1(4.0)Numeric c_2(-4.0)Numeric d_1(5.0)Numeric d_2(-5.0)y^(2) = (a_2 * x)y^(2) = (a_1 * x)Boolean b(false)y^(2) = (b_1 * x)y^(2) = (b_2 * x)Boolean i(false)y^(2) = (c_1 * x)y^(2) = (c_2 * x)Boolean j(false)y^(2) = (d_1 * x)y^(2) = (d_2 * x)Boolean l(false)
AI Drawing Prompt Reference
Draw parabolas of the form y^2 = kx where k can be 1, -1, 2, -2, 3, -3, 4, -4, 5, and -5. Start by drawing the parabolas for k=1 and k=-1, then draw the parabolas for k=2 and k=-2, k=3 and k=-3, k=4 and k=-4, and k=5 and k=-5.
The prompt above was compiled from the original drawing commands and is for reference only.