
Intersection of a Line and a Quadratic Curve
Loading the math board and drawing, please wait…
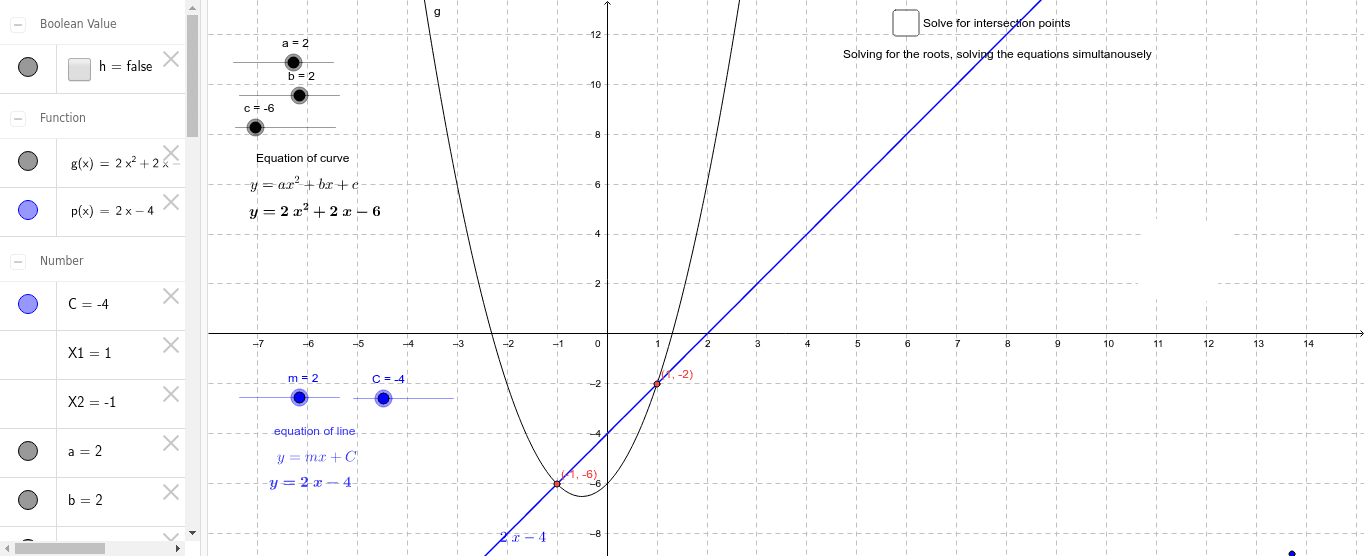
This GeoGebra example demonstrates the intersection points between a straight line and a quadratic curve (such as a parabola, circle, or ellipse), visualizing how algebraic equations correspond to geometric positions. The core mathematical concepts involve linear equations, quadratic equations, solving systems of equations, and the discriminant's role in determining the number of intersections. Construction highlights: the Intersect command is used to directly compute intersection points (e.g., X1, X2), while the Polygon command creates auxiliary polygons (e.g., poly1) for visual reference; sliders or parameters (e.g., m, p) control the line's slope and intercept, allowing dynamic exploration of how intersection points change. This resource is suitable for high school or early college students learning analytic geometry, as well as for teachers demonstrating the algebraic-geometric connection in class or for self-study.
GeoGebra Commands & Parameters
Intersect(p, g, 1) → AIntersect(p, g, 2) → BPolygon(G, H, I, J) → poly1, g_1, h_1, i, j
AI Drawing Prompt Reference
Draw the intersection points between a straight line and a quadratic curve (such as a parabola, circle, or ellipse). First, draw a straight line, then draw a quadratic curve. Use the intersect command to find points A and B where they meet. Finally, draw an auxiliary polygon to help visualize the intersection points.
The prompt above was compiled from the original drawing commands and is for reference only.