
Quadratic Function by Betty Voon Wan Niu
Loading the math board and drawing, please wait…
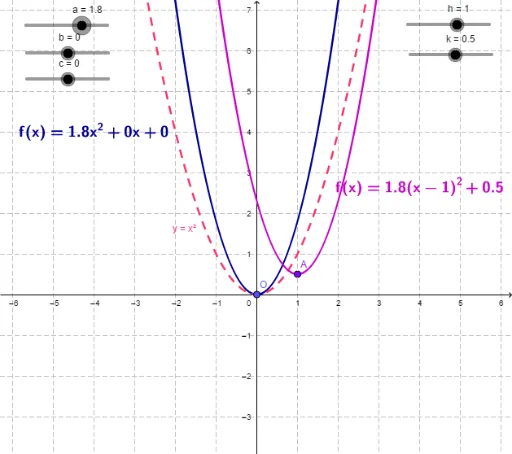
This example demonstrates the graph of a quadratic function, which is a type of polynomial. The general form is f(x) = ax^2 + bx + c. By adjusting the coefficients a, b, and c, you can observe changes in the graph. This example uses GeoGebra's polynomial function and slider animation tools, suitable for middle school and above students to learn about the properties and graph characteristics of quadratic functions.
GeoGebra Commands & Parameters
Numeric a(1.8)Numeric b(0)Numeric c(0)y = (a * x^(2)) + (b * x) + c((-b)) / ((2 * a))c - b^(2) / ((4 * a))Conic dNumeric h(1)Numeric k(0.5)y = (a * (x - h)^(2)) + k(h, k)(0, 0)
AI Drawing Prompt Reference
Draw the graph of a quadratic function in general form y = a*x^2 + b*x + c, with adjustable coefficients a, b, and c. Currently a is about 1.8, b and c are zero, so the parabola opens upward with its vertex at the origin. Also draw another quadratic function in vertex form y = a*(x - h)^2 + k, where h is 1 and k is 0.5, so its vertex is at the point (1, 0.5). Show both parabolas on the same coordinate plane, and mark their vertices clearly: one at (0,0) and the other at (1,0.5). This illustrates how different forms of a quadratic function affect its graph.
The prompt above was compiled from the original drawing commands and is for reference only.