
Linear Function y = mx + c Interactive Demo
Loading the math board and drawing, please wait…
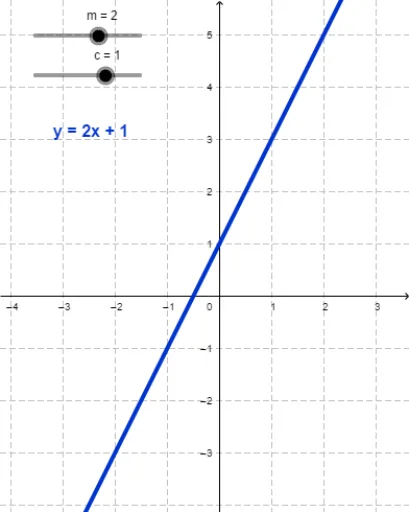
① This GeoGebra example dynamically demonstrates the graph of a linear function y = mx + c, showing how the slope m and y-intercept c affect the line's position and steepness. ② Core mathematical concepts include linear functions, slope, intercept, line equations, and the relationship between parameters and graph shape, forming a foundation for algebra and coordinate geometry. ③ Construction uses sliders for m and c, a text object text1 to display the current equation, and the line updates in real time as sliders move, enabling interactive exploration of parameter effects. ④ Suitable for middle and high school students learning linear functions, as well as for classroom demonstrations or self-study, helping learners grasp the geometric meaning of slope and intercept.
GeoGebra Commands & Parameters
Numeric m(2)Numeric c(1)y = (m * x) + c
AI Drawing Prompt Reference
Create a dynamic graph demonstrating the linear function y = mx + c with two sliders controlling slope m and y-intercept c, a line that updates in real time based on the sliders, and a text label showing the current equation to illustrate how parameter changes affect the line's position and steepness.
The prompt above was compiled from the original drawing commands and is for reference only.