
Quadratic Function and Inequalities
Loading the math board and drawing, please wait…
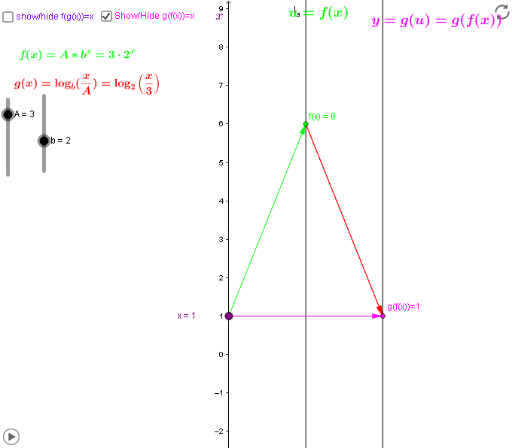
This example demonstrates the relationship between a quadratic function and inequalities. Key mathematical concepts include quadratic functions, inequalities, and coordinate geometry. Using GeoGebra commands such as Point, Vector, and Textfield, the example constructs the graph of a quadratic function, inequality regions, and related points and lines. Suitable for high school mathematics education and learning the properties of quadratic functions and inequalities.
GeoGebra Commands & Parameters
Point(yAxis) → x_*Vector(x_*, B) → uVector(B, C) → vTextfield(g) → inputBox1Textfield(f) → inputBoxfVector(x_*, C) → wVector(x_*, F) → zVector(F, C) → dVector(F, gf_*) → eVector(x_*, gf_*) → i