
QR4-02-CYU4 (Sketching stretches of parabolas)
Loading the math board and drawing, please wait…
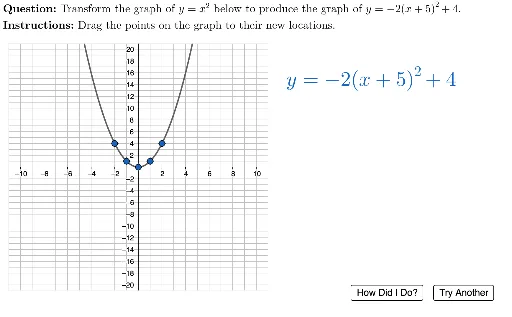
① This interactive example demonstrates how to sketch vertical or horizontal stretches of parabolas by adjusting the quadratic function's parameters, with immediate feedback on correctness. ② Core math concepts include quadratic functions, vertex form, stretching transformations (effect of coefficient on opening direction and width), and the relationship between algebraic expressions and graphs. ③ Construction details: from the summary, the example uses Polygon to create answer regions, PointIn to detect clicks, Element and FitPoly to generate and verify polynomial equations, and LaTeX for displaying formulas; objects include questionList, points A1-A5, auxiliary objects D1-D5, and control buttons like Initialize and TryAnother, enabling dynamic question generation and instant scoring. ④ Suitable for high school students learning transformations of quadratic functions, and useful for classroom demonstrations or self-paced practice to reinforce understanding of how parameters affect parabola shape.
GeoGebra Commands & Parameters
Polygon({(-11, -21), (-11, 21), (11, 21), (11, -21)}) → viewBoxPointIn(viewBox) → CPointIn(viewBox) → APointIn(viewBox) → BPointIn(viewBox) → EPointIn(viewBox) → DElement(questionList, questionListIndex) → questionNumLaTeX(UnicodeToLetter[10007]) → xmarkLaTeX(UnicodeToLetter[10003]) → cmarkElement(P2:P11, questionNum) → correctPointsElement(D2:D11, questionNum) → functionTextLaTeX((("\vphantom{\left(\tfrac{1}{2}\right)}" * functionText) * "")) → displayEquationLaTeX((((("\text{" * QUESTION) * "\\") * INSTRUCTIONS) * "}")) → TEXTFitPoly(startingPoints, 2) → fPolyFitPoly(correctPoints, 2) → gPolyDottedFitPoly(usersPoints, 2) → gPolySolidElement(A2:A11, questionNum) → aElement(B2:B11, questionNum) → hElement(C2:C11, questionNum) → k
AI Drawing Prompt Reference
Create an interactive graphing interface for practicing vertical and horizontal stretches of parabolas. The main area is a rectangular coordinate plane. Five clickable points are randomly placed inside this rectangle. A question is displayed at the top, showing a quadratic function in vertex form with a specific stretch factor. The user must click on five points to sketch the parabola. The system then fits a quadratic curve through the clicked points and compares it to the correct curve, which is shown as a dotted line. A checkmark appears if the sketch is correct, otherwise a cross. Buttons for 'Initialize' and 'Try Another' are provided to reset or generate a new question.
The prompt above was compiled from the original drawing commands and is for reference only.