
Pythagorean Theorem and Logarithmic Function Visualization
Loading the math board and drawing, please wait…
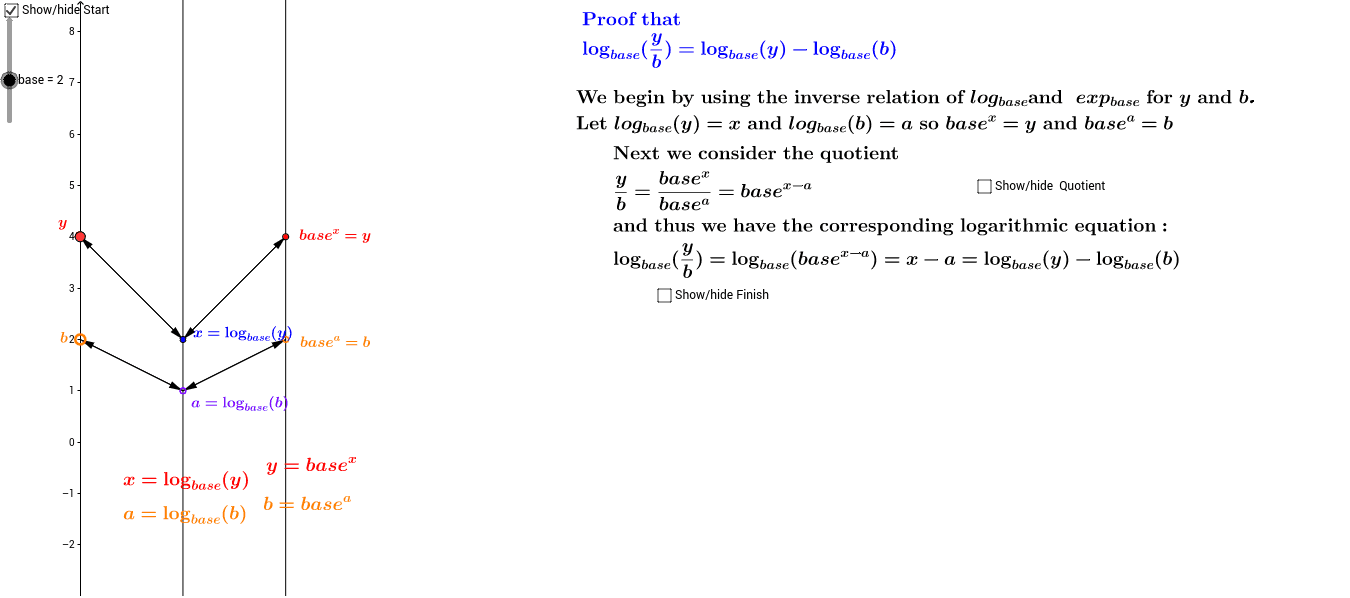
This example demonstrates the geometric integration of the Pythagorean Theorem and logarithmic functions, visually showcasing function properties and geometric relationships through dynamic graphics. Core math concepts include the Pythagorean Theorem, logarithmic functions, vector operations, and logical reasoning. GeoGebra commands used in construction are Point, Textfield, and Vector to build function graphs, vectors, and geometric shapes. Suitable for high school and above mathematics learning, exploring the intersection of functions and geometry.
GeoGebra Commands & Parameters
Point(yAxis) → A_1Textfield(f) → inputBox1Vector(A_1, B_2) → vVector(B_2, A_2) → wPoint(yAxis) → BVector(B, C) → uVector(C, D) → zVector(E, F) → eVector(A_2, E) → iVector(D, E) → jVector(B_2, F) → kVector(C, F) → lVector(B_2, A_1) → mVector(C, B) → nVector(F, E) → pVector(A_2, B_2) → qVector(D, C) → s
AI Drawing Prompt Reference
Draw a geometric illustration showing the Pythagorean Theorem and logarithmic functions, involving multiple points and vectors. Use dynamic graphics to display the properties of functions and geometric relationships. Start by plotting points on the coordinate axes, then construct vectors connecting these points to form geometric shapes. Highlight the interactions between vectors, such as parallelism and perpendicularity, and label key points to demonstrate the geometric significance of the Pythagorean Theorem and logarithmic functions.
The prompt above was compiled from the original drawing commands and is for reference only.