
Proportion Hypothesis Test Problems
Loading the math board and drawing, please wait…
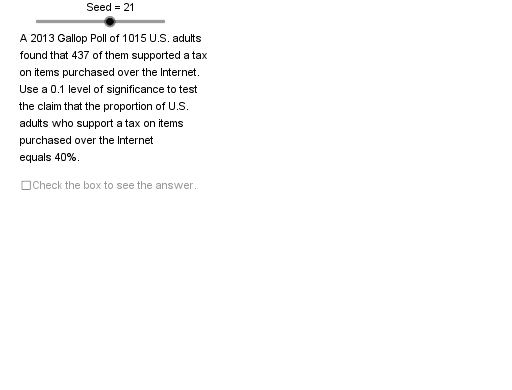
This example demonstrates proportion hypothesis testing problems. Key mathematical concepts include hypothesis testing and statistics. Construction highlights include using GeoGebra commands such as Element, Sequence, If, Mod, Normal, etc., to build statistical models. Suitable for high school or college statistics courses.
GeoGebra Commands & Parameters
Element(NSq, Op3) → NElement(XSq, Op3) → XSequence(Mod[3 + (11 * k), 36] + 1, k, 1, 36) → OpSq2Element(OpSq2, Seed) → Op2If(Mod[Op2, 6] < 3, -1, 1) → RndDirSequence(Mod[6 + (17 * k), 36] + 1, k, 1, 36) → OpSq0Element(OpSq0, Seed) → Op0Element(CnfSq, Mod[Op0, 4] + 1) → CfdSequence(Mod[4 + (13 * k), 36] + 1, k, 1, 36) → OpSq1Element(OpSq1, Seed) → Op1Mod(Op1, 6) → PrbOptIf(PrbOpt < 2, -1, If[PrbOpt > 3, 1, 0]) → TypeIf(Type ≟ 0, (-InverseNormal[0, 1, α / 2]), (-InverseNormal[0, 1, α])) → CVIf(Phat < P0, -1, If[Phat > P0, 1, 0]) → DtDrIf(Mod[Op1, 2] ≟ 0, 1, -1) → EONIf(DtDr ≟ -1, If[EON ≟ 1, 0, 1], If[EON ≟ 1, 0, -1]) → IEDrIf(IEDr ≟ 1, "is less than ", If[IEDr ≟ -1, "is more than ", "equals "]) → IETxIf(DtDr ≟ -1, If[EON ≟ 1, " equals ", "is less than "], If[EON ≟ 1, " equals ", "is more than "]) → TypTx2If(Phat > 0.5, Phat, 1 - Phat) → PHHiIf(Phat > 0.5, 1 - Phat, Phat) → PHLoIf(PrbOpt < 3, -1, 1) → ClcDrNormal(0, 1, TstSt) → PVLT0Min(PVLT0, PVRT0) → PVhfIf(PVLT0 < 1.0E-4, 1.0E-4, PVLT0) → PVLT1If(PVTT0 < 1.0E-4, " < ", " = ") → PVTTsgIf(PVTT0 < 1.0E-4, 1.0E-4, PVTT0) → PVTT1If(PVRT0 < 1.0E-4, 1.0E-4, PVRT0) → PVRT1If(PVRT0 < 1.0E-4, " < ", " = ") → PVRTsgIf(PVLT0 < 1.0E-4, " < ", " = ") → PVLTsgIf(IEDr ≟ -1, " > ", If[IEDr ≟ 1, " < ", " ≠ "]) → DrSgnNllIf(IEDr ≟ -1, " ≤ ", If[IEDr ≟ 1, " ≥ ", " = "]) → DrSgnAltIf(IEDr ≟ -1, "right-tailed", If[IEDr ≟ 1, "left-tailed", "two-tailed"]) → TypTx1If(Type ≟ -1, "≤ ", " ≥ ") → PVKSgIf(IEDr ≟ -1, PVRT1, If[IEDr ≟ 1, PVLT1, PVTT1]) → PVIf(PV < α, "<", "≥") → CmpIEIf(PV < α, "reject", "keep") → DCSIf(PV < α, "is", "is not") → OrNotIf(PV < 1.0E-4, "<", "=") → PVsgElement(PSSq, Op3) → PS0If(IEDr ≟ 1, "is less than ", If[IEDr ≟ -1, "is more than ", "does not equal "]) → ConIETxIf(IEDr ≟ 1, PVLTtx, If[IEDr ≟ -1, PVGTtx, PVTTtx]) → PVClc
AI Drawing Prompt Reference
Create a statistical chart demonstrating proportion hypothesis testing. Include normal distribution curves, critical value lines, and sample proportion, with color and arrows indicating rejection or acceptance regions for the null hypothesis, and label the relationship between P-value and significance level α.
The prompt above was compiled from the original drawing commands and is for reference only.