
Properties of Linear Functions: Slope, Intercepts, and Graph Exploration
Loading the math board and drawing, please wait…
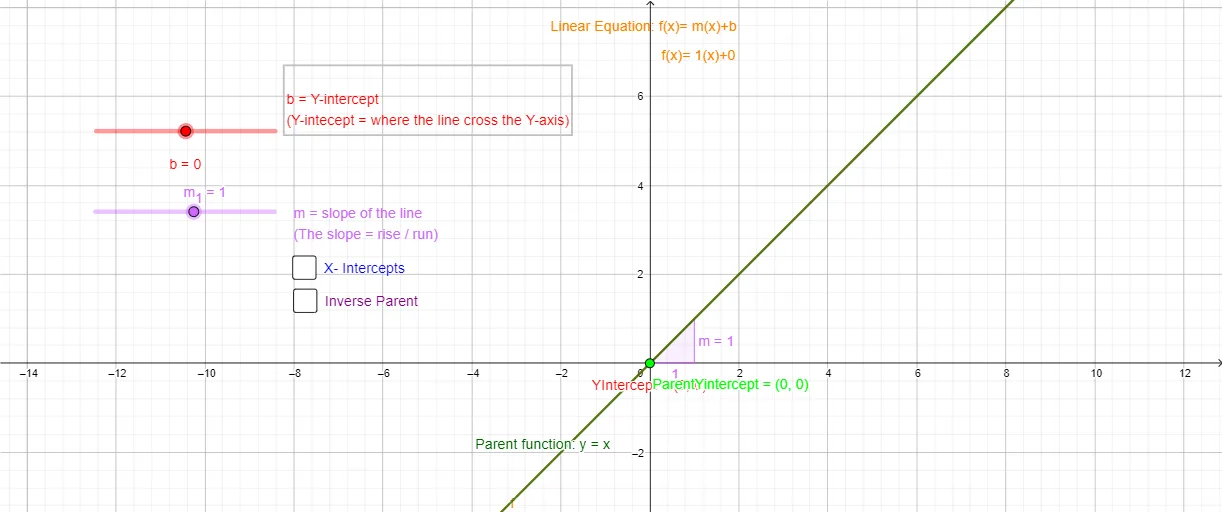
① This interactive GeoGebra example visually demonstrates the graph of a linear function y = mx + b, focusing on how the slope m and y-intercept b affect the line's steepness and position, while also displaying the x-intercept and slope values dynamically. ② Core mathematical concepts include linear functions, slope, intercepts (y-intercept and x-intercept), function graphs, and the relationship between algebraic parameters and geometric features, with extensions to isosceles triangles and geometric mean. ③ Construction details: The example uses GeoGebra commands Intersect to find the intersections of the line with the coordinate axes (XIntercept, YIntercept) and Slope to compute the slope m. Text objects (text1 to text6) dynamically display the slope and intercept values. A parent function Parent and auxiliary line g are constructed with parameters a and b₁ to allow interactive manipulation, making it easy to observe how changing parameters alters the graph. ④ Suitable for middle school to high school students learning linear functions and coordinate geometry, as well as for teachers demonstrating the properties of linear functions in class, fostering a visual understanding of slope and intercepts.
GeoGebra Commands & Parameters
Intersect(f, yAxis) → YInterceptSlope(f) → mIntersect(f, xAxis) → XIntercept
AI Drawing Prompt Reference
Draw the graph of a linear function y = mx + b, where m is the slope and b is the y-intercept. Dynamically show the x-intercept and slope values. Use sliders to adjust the values of m and b and observe how the line changes.
The prompt above was compiled from the original drawing commands and is for reference only.