
Probability Simulation Experiment
Loading the math board and drawing, please wait…
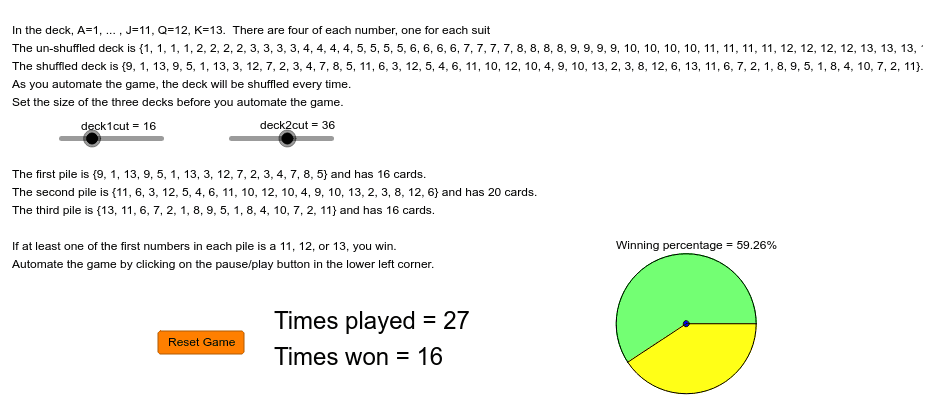
This example demonstrates a simulation experiment in probability and statistics. Through automated simulation, it showcases the application of probability and statistics. Core math concepts involved include probability, statistics, arithmetic, bar chart, arithmetic mean, etc. Construction highlights use of GeoGebra commands and objects like Sequence, Shuffle, Take, Circle, Rotate, CircleSector, Segment, and entities such as deck, mix, winnings. Suitable for high school students learning probability and statistics to understand the patterns of random phenomena.
GeoGebra Commands & Parameters
Sequence(floor(a), a, 1, 13.75, 0.25) → deckShuffle(deck) → mixTake(mix, 1, deck1cut) → deck1Take(mix, deck1cut + 1, deck2cut) → deck2Take(mix, deck2cut + 1, 52) → deck3Circle(A, B) → cRotate(B, ((winnings / timesplay * 360))°, A) → B'CircleSector(A, B, B') → dCircleSector(A, B', B) → eSegment(A, B') → aSegment(A, B) → b
AI Drawing Prompt Reference
Visualize a probability and statistics simulation experiment with a deck of 52 cards, showing shuffling and splitting into three groups. Represent randomly drawn cards using circles and sectors, connecting them with lines to illustrate the application of probability and statistics.
The prompt above was compiled from the original drawing commands and is for reference only.