
Probability of Counters in a Bag
Loading the math board and drawing, please wait…
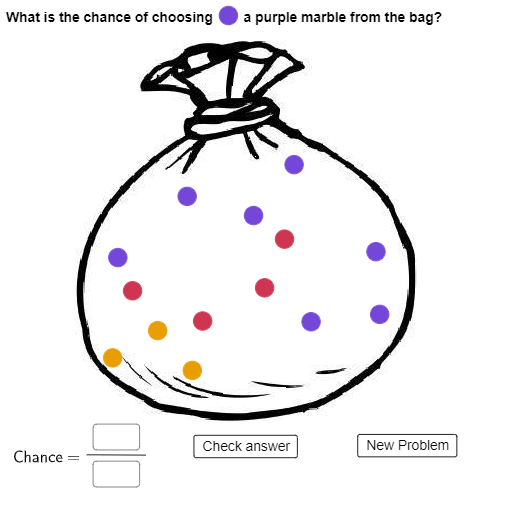
This example demonstrates the dynamic simulation of probability distribution and statistical processes of counters (colored balls) in a bag using GeoGebra. It involves core math concepts like probability calculation, upper and lower sums (Riemann sums), quadratic equations, Pythagorean theorem, real number operations, and subtraction. The construction utilizes GeoGebra commands and objects such as Circle, Element, Segment, Midpoint, Vector, If, and Textfield. It is suitable for high school mathematics teaching, providing an intuitive understanding and visualization of initial concepts in probability statistics and calculus.
GeoGebra Commands & Parameters
Circle(G, 0.25) → gCircle(H, 0.25) → hCircle(I, 0.25) → kCircle(J, 0.25) → pCircle(K, 0.25) → qCircle(L, 0.25) → rCircle(M, 0.25) → sCircle(N, 0.25) → tCircle(O, 0.25) → c_1Circle(P, 0.25) → d_1Circle(Q, 0.25) → e_1Circle(R, 0.25) → f_1Circle(S, 0.25) → g_1Circle(T, 0.25) → h_1Circle(U, 0.25) → k_1Circle(V, 0.25) → p_1Circle(W, 0.25) → q_1Circle(Z, 0.25) → r_1Circle(A_1, 0.25) → s_1Circle(B_1, 0.25) → t_1Circle(C_1, 0.25) → c_2Circle(D_1, 0.25) → d_2Circle(E_1, 0.25) → e_2Circle(F_1, 0.25) → f_2Circle(G_1, 0.25) → g_2Circle(H_1, 0.25) → h_2Element(Color, Choose) → text1Circle(G_2, 0.25) → g_3Circle(G_3, 0.25) → g_4Circle(G_4, 0.25) → g_5Circle(G_5, 0.25) → g_6Segment(I_1, J_1) → iMidpoint(i) → K_1Vector(L_1, I_1) → uVector(M_1, K_1) → vVector(N_1, J_1) → wVector(Z_1, W_1) → jSegment(A_2, B_2) → i_1If(Choose ≟ 1, Orange, If[Choose ≟ 2, Purple, If[Choose ≟ 3, Yellow, If[Choose ≟ 4, Red]]]) → numberTextfield(numerator) → numeratorBoxTextfield(denominator) → denominatorBoxIf(numerator / denominator ≟ number / Total, "Correct!", "Try again") → text16Circle(C_2, 0.25) → k_2Circle(C_2, 0.25) → p_2Circle(C_2, 0.25) → q_2Circle(C_2, 0.25) → r_2
AI Drawing Prompt Reference
Draw a bag containing multiple balls of different colors to demonstrate probability distribution and statistical processes. Use circles to represent the balls and show mathematical concepts like probability calculation, Riemann sums, quadratic equations, and Pythagorean theorem through vectors, segments, and text fields. Start by drawing several balls of different colors, then add vectors, segments, and text fields, and finally display dynamic prompts indicating correctness based on probability calculations.
The prompt above was compiled from the original drawing commands and is for reference only.