
Probability: Drawing Colored Balls
Loading the math board and drawing, please wait…
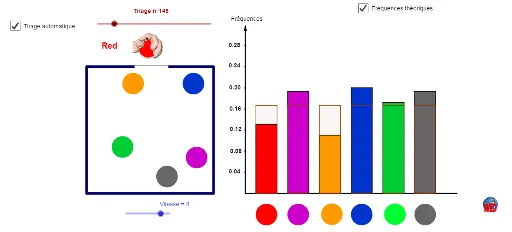
This example demonstrates the probability of drawing colored balls from a container. Key mathematical concepts include probability and statistics. Using GeoGebra commands such as Polygon, Circle, and Sequence, a dynamic model of ball drawing can be constructed. Suitable for students at the middle school level and above to learn about probability and statistics.
GeoGebra Commands & Parameters
Polygon(E, F, 4) → poly1, e_1, f_1, h, i, G, HCircle(C, 1) → k_1Circle(A, 1) → pCircle(AA, 1) → tCircle(I, 1) → c_1Circle(M, 1) → d_1Circle(J, 1) → g_1Sequence(Random[1, 6], i, 1, 1000) → liste1First(liste1, n) → TirageCountIf(x ≟ 1, Tirage) → B3CountIf(x ≟ 2, Tirage) → B4CountIf(x ≟ 3, Tirage) → B5CountIf(x ≟ 4, Tirage) → B6CountIf(x ≟ 5, Tirage) → B7CountIf(x ≟ 6, Tirage) → B8Element(liste1, n) → ddCircle(O, 1) → eCircle(O, 1) → fCircle(O, 1) → gCircle(O, 1) → qCircle(O, 1) → rCircle(O, 1) → sPoint(h) → PPoint(h) → QSegment(P, Q) → jSegment(R, S) → mSegment(R, T) → a_1Point(m) → UPoint(m) → VPoint(m) → WPoint(m) → ZPoint(m) → A_1Point(m) → B_1Point(m) → C_1Point(m) → D_1Point(m) → E_1Point(m) → F_1Polygon(U, V, I_1, G_1) → poly2, u, v, i_1, g_2Polygon(W, J_1, K_1, Z) → poly3, w, j_1, k_2, zPolygon(A_1, B_1, M_1, L_1) → poly4, a_2, b_1, m_1, l_1Polygon(N_1, O_1, D_1, C_1) → poly5, n_1, o_1, d_2, c_2Point(m) → P_1Point(m) → Q_1Polygon(E_1, F_1, S_1, R_1) → poly6, e_2, f_2, s_1, r_1Polygon(P_1, Q_1, U_1, T_1) → poly7, p_1, q_1, u_1, t_1Point(a_1) → H_1Point(a_1) → V_1Point(a_1) → W_1Point(a_1) → Z_1Point(a_1) → A_2Point(a_1) → B_2Point(a_1) → C_2Vector(R, T) → v_1Polygon(P_1, D_2, F_2, Q_1) → poly8, p_2, d_3, f_3, q_2Polygon(H_2, G_2, F_1, E_1) → poly9, h_2, g_3, f_4, e_3Polygon(J_2, I_2, D_1, C_1) → poly10, j_2, i_2, d_4, c_3Polygon(L_2, K_2, B_1, A_1) → poly11, l_2, k_3, b_2, a_3Polygon(N_2, M_2, Z, W) → poly12, n_2, m_2, z_1, w_1Polygon(P_2, O_2, V, U) → poly13, p_3, o_2, v_2, u_2Circle(Q_2, 1) → h_1Circle(R_2, 1) → r_2Circle(S_2, 1) → s_2Circle(T_2, 1) → t_2Circle(U_2, 1) → h_3Circle(V_2, 1) → q_3
AI Drawing Prompt Reference
This is a probability model for drawing colored balls from a container. The graph includes a container and several colored balls. The container holds balls of different colors, and drawing randomly selects one ball. The graph shows the drawn ball and statistics on the number of draws. The construction order is to first draw the container and balls, then add the drawing simulation and statistics charts.
The prompt above was compiled from the original drawing commands and is for reference only.