
Prism Limits
Loading the math board and drawing, please wait…
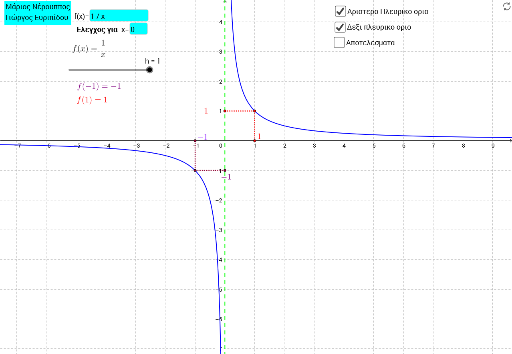
This example demonstrates the concept of limits in prisms. It involves geometric construction and function graphing. Using GeoGebra commands such as Limit, Segment, and Name, it dynamically shows the changes in prism limits. Suitable for high school math education and learning.
GeoGebra Commands & Parameters
Limit(f, limitx) → aTextfield(f) → inputBox1Textfield(limitx) → inputBox2LimitAbove(f, limitx) → bLimitBelow(f, limitx) → cSegment(C_x, C) → dSegment(C_y, C) → iSegment(F_y, F) → kSegment(F, F_x) → lName(X) → A1Name(Y) → B1
AI Drawing Prompt Reference
Create a 3D prism illustration that demonstrates the concept of limits. Include a function curve with two input boxes for adjusting the limit value and the variable. Draw vertical and horizontal dashed segments from points on the curve to the axes, showing the approach from above and below. Label two key vertices of the prism with distinct names. The scene should clearly combine the function's limit behavior with the prism's geometric structure, suitable for educational visualization.
The prompt above was compiled from the original drawing commands and is for reference only.