
Sequential Limits: Convergent
Loading the math board and drawing, please wait…
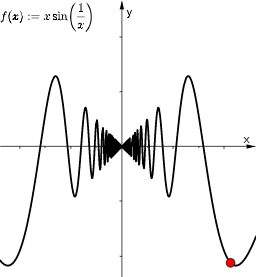
This example demonstrates the graphical representation of the convergence of sequential limits. Core mathematical concepts include limits, symmetry, secant lines, median lines, geometric distribution, and piecewise functions. It utilizes GeoGebra commands/objects like SelectedIndex, Element, Zip, ListFunc, ListName, ind, SelectedFunc, n, Ln, k, text3, f, l1, l2, l3, text1, text2, speed, text4, text5 for construction. Suitable for high school and above mathematics learners to understand limit theory and function behavior.
GeoGebra Commands & Parameters
SelectedIndex(ListName) → indElement(ListFunc, ind) → SelectedFuncZip(SelectedFunc(s), s, Ln) → l1Zip((x0, y0), x0, Ln, y0, l1) → l2Zip((x0, f(x0)), x0, l1) → l3
AI Drawing Prompt Reference
Draw a graph showing the convergence of a sequence, illustrating limit theory. First, plot the function f(x), then draw two median lines l1 and l2, and finally draw two secant lines l3 to demonstrate the function behavior and the convergence to the limit value.
The prompt above was compiled from the original drawing commands and is for reference only.