
Limits and Asymptotes
Loading the math board and drawing, please wait…
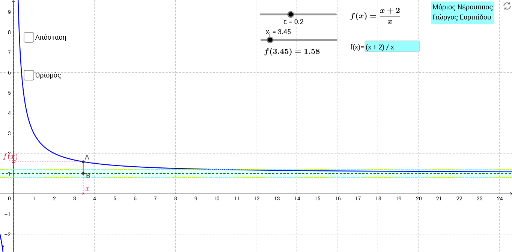
This example demonstrates the geometric representation of function limits and asymptotes. It involves core math concepts like limits, parallelograms, polygons, matrices, orthocenters, and frequency distributions. Construction highlights include commands like Limit, Asymptote, Distance, Segment, If, Intersect, and Textfield from GeoGebra. Suitable for high school and above, focusing on calculus and coordinate geometry education.
GeoGebra Commands & Parameters
Limit(f, Infinity) → lim_fAsymptote(f) → asymptotesDistance(A, B) → bSegment(A, B) → distanceIf(f(0) > lim_f, e_u, e_l) → c_xIntersect(f, c_x, (10, 1.2)) → CSegment(C, D) → aSegment(F, A) → eSegment(B, E) → cTextfield(f) → inputBox1
AI Drawing Prompt Reference
Draw a graph showing function limits and asymptotes. The graph includes a function curve, a limit value marker, an asymptote line, and a line segment representing distance. The construction order is to first draw the function curve, then determine the limit value, then draw the asymptote line, and finally add the distance line segment and markers.
The prompt above was compiled from the original drawing commands and is for reference only.