
Limit and Function Graphing Example
Loading the math board and drawing, please wait…
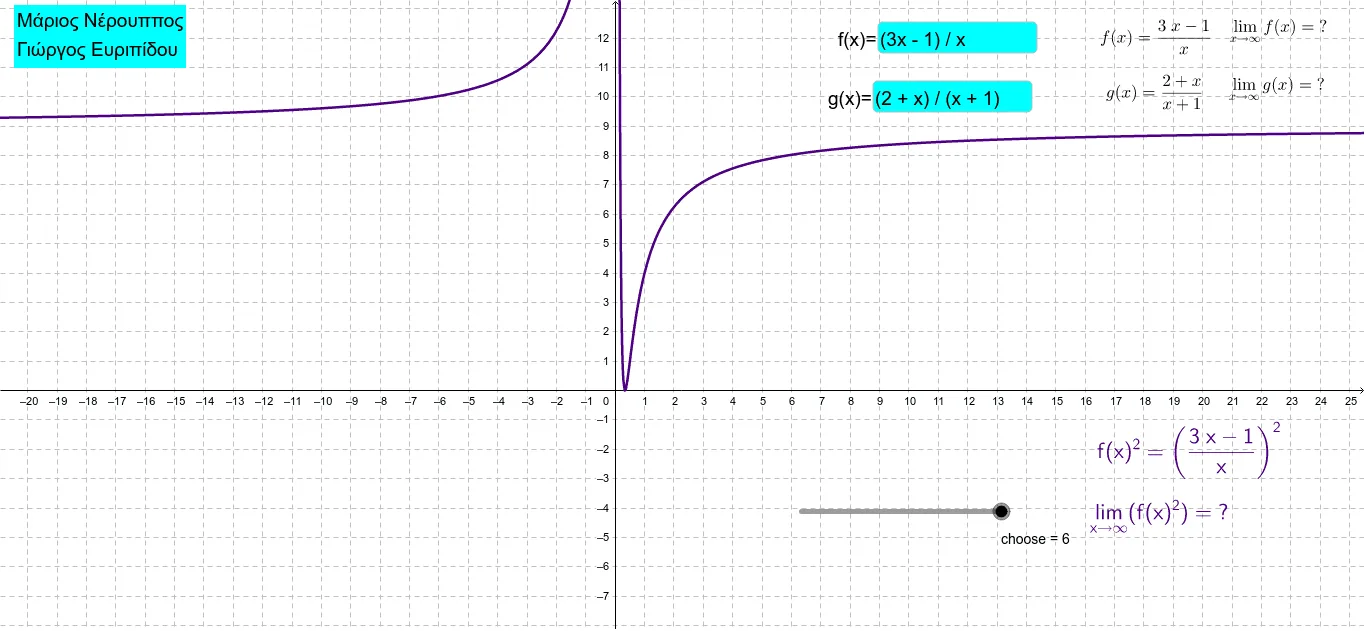
This example demonstrates how to construct limits and function graphs using GeoGebra. Key mathematical concepts include limits, functions, coordinate geometry, and calculus. Construction involves using commands like Asymptote, Limit, and Textfield, along with expressions such as f, f+g, and f-g. Suitable for high school students or college freshmen learning limit and function graphing.
GeoGebra Commands & Parameters
Asymptote(f) → Asymptotes_fAsymptote(g) → Asymptotes_gLaTeX(f, true, true) → text1Limit(f, Infinity) → lim_fLimit(g, Infinity) → lim_gLimit(f(x) + g(x), Infinity) → lim_{f+g}Asymptote(f(x) + g(x)) → Asymptote_{f+g}Asymptote(p) → Asymptotes_{2f}Limit(p, Infinity) → lim_{2f}Asymptote(q) → Asymptote_{f-g}Limit(q, Infinity) → lim_{f-g}Asymptote(r) → Asymptote_{f.g}Limit(r, Infinity) → lim_{f.g}Asymptote(s) → Asymptote_{f/g}Limit(s, Infinity) → lim_{f/g}Asymptote(t) → Asymptote_{f^2}Limit(t, Infinity) → lim_{f^2}Textfield(f) → inputBox1Textfield(g) → inputBox2
AI Drawing Prompt Reference
Draw the graphs of two functions f and g, including their asymptotes and limits, as well as the limits and asymptotes of f+g, 2f, f-g, f·g, f/g, and f^2 at infinity. Start by drawing the graphs of f and g, then mark their asymptotes. Next, calculate and display the limits of f and g at infinity, and then calculate and mark the limits of f+g, 2f, f-g, f·g, f/g, and f^2 at infinity.
The prompt above was compiled from the original drawing commands and is for reference only.