
AP Calc: Graphical Limits (Geometric Intuition for Limits)
Loading the math board and drawing, please wait…
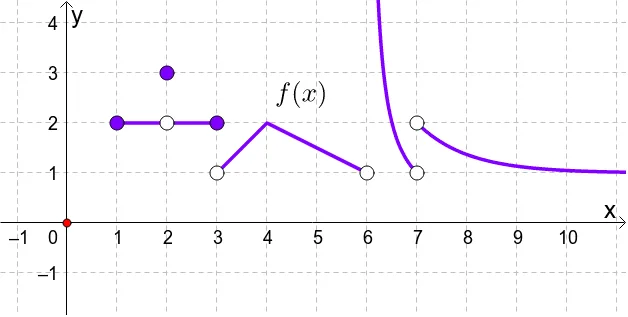
This GeoGebra applet demonstrates limits graphically by showing how a function’s behavior approaches a target value as the input moves closer to a particular point. It builds intuition for the limit concept using geometric constructions rather than only symbolic computation. The core ideas are limit as a “trending value” (based on approach), the local behavior of a function near special points, and how inequalities/constraints can be visualized alongside the graph. Construction-wise, it uses the GeoGebra commands Point and Vector to define key points (A, B, C, D) and direction/placement vectors (u, v), along with a function object f to represent the function whose limit is being studied. Additional derived points (C_1, B_1, B_2, B_3, B_4) capture intermediate or approaching positions, while text1 labels and contextualizes the plotted scenario. Suitable for AP Calculus and early undergraduate calculus courses as a classroom demonstration or self-study tool for understanding limits visually.
GeoGebra Commands & Parameters
Point(xAxis) → DVector((x(D), 0), (x(D), f(x(D)))) → uVector((x(D), f(x(D))), (0, f(x(D)))) → v
AI Drawing Prompt Reference
Draw the graph of a function f(x) and mark a point D on the x-axis. Draw a vertical vector u upwards from point D and a horizontal vector v upwards from point D. These vectors help illustrate the function's behavior as it approaches a specific point, aiding in understanding the concept of limits.
The prompt above was compiled from the original drawing commands and is for reference only.