
Limit and Trigonometry Demo
Loading the math board and drawing, please wait…
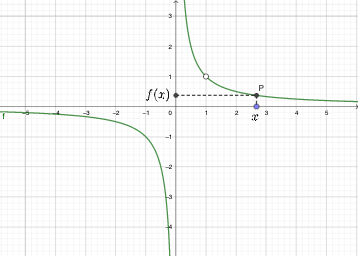
This example dynamically demonstrates the relationship between function limits, trigonometric functions, and power functions, showing the intersection of tangent lines with function graphs. Core math concepts include limits, trigonometric functions, power functions, tangent lines, and function graph intersections. GeoGebra commands like Point, OrthogonalLine, Intersect, and Segment are used to construct function images and tangents. Suitable for high school calculus teaching and function property exploration.
GeoGebra Commands & Parameters
Point(xAxis) → BOrthogonalLine(B, xAxis) → gIntersect(f, g, (2.6787463140288903, 0.37330895977827)) → POrthogonalLine(P, yAxis) → hIntersect(h, yAxis) → DSegment(D, P) → iSegment(P, B) → j
AI Drawing Prompt Reference
Draw a coordinate plane with a function curve. Place a movable point on the x-axis. Construct a vertical line through this point intersecting the curve at a point. From that intersection, draw a horizontal line to the y-axis, marking the intersection. Connect the y-axis intersection to the curve point, and the curve point to the x-axis point, forming two segments. This illustrates the relationship between the function, perpendicular lines, and intersections, demonstrating limits and trigonometric concepts.
The prompt above was compiled from the original drawing commands and is for reference only.