
Predicting Future Inflation's Impact on Prices
Loading the math board and drawing, please wait…
In collections
CCGPS AA Unit 6 Lesson 1
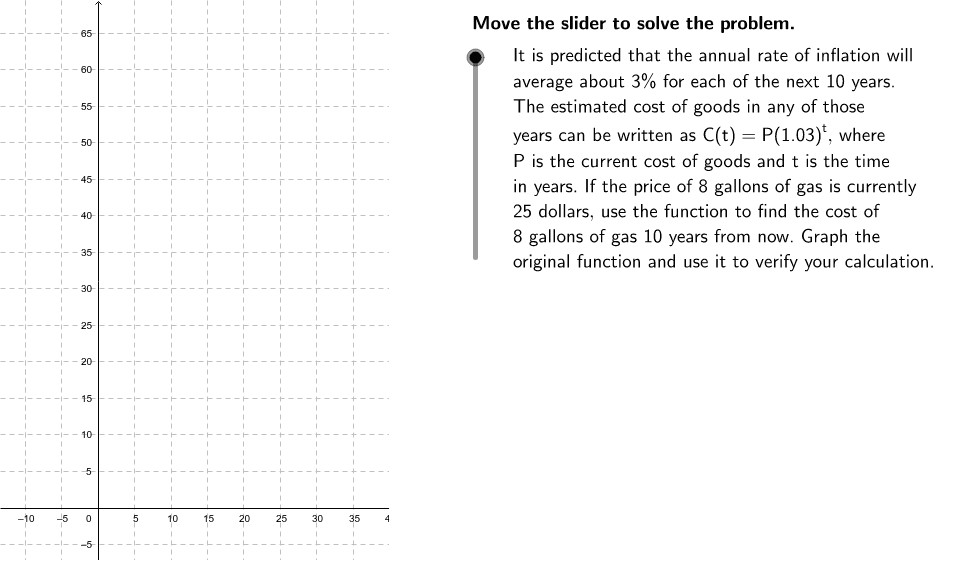
This example demonstrates the impact of a predicted 3% annual inflation rate over the next 10 years on prices, illustrating exponential functions. Using GeoGebra commands like `Corner`, `Polygon`, `price`, `rate`, `rate2`, `years`, etc., it shows how to construct and dynamically demonstrate these concepts. Suitable for high school math education, particularly in the context of exponential functions and real-world applications.
GeoGebra Commands & Parameters
Corner(3) → C3Corner(1) → C1Corner(4) → C4Corner(2) → C2Polygon(C2, C3, (Edge, y(C3)), (Edge, y(C2))) → Mask, c2, c3, d, e
AI Drawing Prompt Reference
Draw a graph showing the price changes over the next 10 years with a 3% annual inflation rate. Start by drawing four corner points, then construct a quadrilateral using these points. Next, draw two curves representing price changes, one starting from the first corner point and the other from the second corner point, to illustrate exponential growth over time.
The prompt above was compiled from the original drawing commands and is for reference only.