
Practice Rational Functions
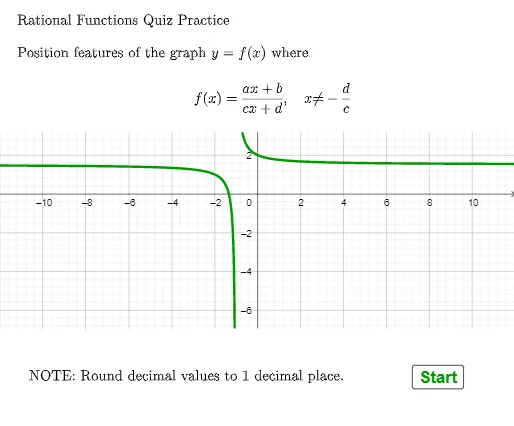
Loading the math board and drawing, please wait…
In collections
Grade 12 PreCalculus BC
This example demonstrates how to plot linear functions and their graph features. It involves core math concepts like function graphs, linear equations, arithmetic mean, and calculus. Construction highlights include commands like RandomElement, Random, Remove, If, Simplify, Point, Line, Corner, FractionText, and objects such as dDlist1, dDranlist1, alist, etc. Suitable for high school and above students for teaching function graphing and feature analysis.
GeoGebra Commands & Parameters
RandomElement(dDlist1) → dDranlist1Random(-6, 6) → bBRemove(dDlist1, {bB, (-bB)}) → dDlist2RandomElement(dDlist2) → dDranlist2RandomElement(alist) → aAranRandomElement(clist) → cCIf(aA ≟ cC, dDranlist2, If[aA ≟ (-cC), dDranlist2, dDranlist1]) → dDSimplify((cC * x) + dD) → gSimplify((aA * x) + bB) → fPoint(yAxis) → STUDYPoint(xAxis) → STUDXLine(C, D) → iPoint(i) → STUDVALine(F, G) → jPoint(j) → STUDHACorner(5) → dimsFractionText(exempt) → exemptfrac
AI Drawing Prompt Reference
Plot two linear function graphs on a coordinate plane and emphasize their key marked features for analysis. First choose several random constants to form two expressions of the form y = ax + b, then draw the corresponding lines. Mark important points associated with the axes and the constructed lines, connect the relevant points to make the line visuals clear, and include a corner/angle-style dimension annotation for measurement context. Add a fraction-text placeholder element to support displaying a computation-related fraction form.
The prompt above was compiled from the original drawing commands and is for reference only.